"ABRUPT CLIMATE CHANGE" . . "HELL OF ALL HELLS" . . IS HERE! EVIL RICH &/OR RIGHT WING! EITHER SUPPORT . . "THE NORDIC MODEL!" . . BERNIE / AOC / THE SQUAD! . . AND . . MASSIVE SPENDING TO HELP . . . . "THOSE IN NEED!" . . DUE TO . . "ABRUPT CLIMATE CHANGE" . . CAUSED BY . . . . "YOU EVIL RICH & RIGHT WING MONEY MONSTERS AND MONEY SLUTS!" & . . "GIFT ALL OF YOUR WELATH ABOVE $20 MILLION!" . . OR . . IF YOU ARE . . ONE OF . . "THOSE THAT . . WORKED EXTREME . . "INIQUITY!" . .OF . . . . "WEALTH" . . "INCOME" . . OR . . "INJUSTICE!" . . "YOU DID 9/11!" . . OR . . "WERE PAID TO COVER UP 9/11!" EVIL RICH! "SELL EVERYTHING!" . . AND . . "GIFT IT TO . . THOSE IN NEED!" . . "YOUR EVIL GREED CAUSED!" & . . "DIE PENNILESS" HELPING . . "THOSE IN NEED YOUR GREED DAMNED!" OR "FRY BABY FRY!" IN "THE VERY HELL OF ALL HELLS YOUR GREED CAUSED!" DESANTIS . . "YOU SATANIC MONEY SLUT!" . . AS MUCH AS WE SHOULD NEVER! . . WISH FOR EVEN THOSE WHO HAVE . . "PERSECUTED US!" . . ANY HARM! "WE SHOULD . . FORGIVE THOSE WHO HAVE PERSECUTED US!" . . SERIOUSLY! . . "YES . . PAPPA!" . . "YES . . TEACHER!" . . I WILL ALWAYS . . "TRY" . . TO . . . . "BE PERFECT!" . . "AS . . OUR FATHER . . IN HEAVEN!" . . "IS PERFECT!" Love for Enemies 43 “You have heard that it was said, ‘Love your neighbor[a] and hate your enemy.’ 44 But I tell you, love your enemies and pray for those who persecute you, 45 that you may be children of your Father in heaven. He causes his sun to rise on the evil and the good, and sends rain on the righteous and the unrighteous. 46 If you love those who love you, what reward will you get? Are not even the tax collectors doing that? 47 And if you greet only your own people, what are you doing more than others? Do not even pagans do that? 48 Be perfect, therefore, as your heavenly Father is perfect. CHRIST . . IS . . "THE PERFECT EXAMPLE!" . . WHY DID THE APOSTLES . . . . "NOT" . . CALL . . JESUS CHRIST . . "THE REDEEMER!" . . IF HIS PURPOSE . . . . WAS TO . . "BE CRUCIFIED BY RUTHLESS EVIL RICH AND FALSE RELIGIOUS!" THEN TO . . "RISE AGAIN ON THE THIRD DAY!" . . TO PROVIDE A . . . . "GET OUT OF HELL FREE CARD!" . . FOR SIMPLY . . "PROFESSING FAITH IN HIM!" AS I JOKE . . "HOW COULD HE NOT SAY!" . . "GO . . AND . . SIN ALL YOU WANT!" . . "YOU RUTHLESS RICH EVIL MONEY MONSTERS & THEIR EVIL MONEY SLUTS!" . . "AFTER GIVING ME . . THE SEND-OFF . . I WILL NEVER!" . . "EVER FORGET!" "HOW COULD I . . NOT . . SAY!" . . "GO . . AND . . SIN ALL YOU WANT!" . . OMG! THE APOSTLES CALLED CHRIST . . "TEACHER" . . AS . . "HIS TEACHINGS!" . . TELL US HOW TO LIVE OUR LIVES BY . . "LOVING GOD" . . ABOVE ALL ELSE! THEN AS MY SPIRITUAL SOUL SISTER TORI KELLY SINGS SO . . "SPIRITUALLY!" . . "PLEASE TEACH ME TO . . LOVE OTHERS . . THE WAY THAT . . YOU LOVE ME!" "THE OLD TESTAMENT" . . AS I TOLD MY PROF FOR . . "THE NEW TESTAMENT!" . . IN THE CATHOLIC SEMINARY AT "AQUINAS COLLEGE" . . DREAMING ABOUT . . BECOMING THOMAS AQUINAS AUTHOR OF THE SUMA THEOLOGICA! . . IS . . "LOGICALLY INCONSISTENT" . . WITH . . "THE NEW TESTAMENT!" . . SHE ASKED . . "WHAT DO YOU MEAN!" . . I ASKED HER . . "HOW MANY COMMANDMENTS" . . ARE THERE? . . SHE IMMEDIATELY SAID . . "10 OF COURSE!" . . I SAID . . THERE IS ONLY . . "ONE COMMANDMENT!" . . SHE SAID WHAT DO YOU MEAN? . . I SAID . . READ . . "THE FINAL JUDGEMENT!" . . MATTHEW 25:31-46 . . DID CHRIST SAY . . "I WILL SCORE THEM ON THE 10 COMMANDMENTS!?" DID CHRIST SAY . . "JUST BELIEVE IN ME" . . AND . . "I WILL SAVE YOU?" "NO!" . . HE SAID . . "THOSE WHO TAKE CARE OF" . . "THOSE IN NEED!" "NOT!" . . "THEIR EVIL RUTHLESS GREED FOR MONEY!" . . "WILL BE BLESSED!" THOSE WHO . . "LIVE FOR . . MONEY!" . . "NOT . . GOD!" "NOT" TAKING CARE OF . . THOSE WHO ARE HUNGRY, THIRSTY, NEED CLOTHS, HEALTHCARE, A HOME . . . . OR ARE IN PRISON! . . WILL BE . . "THROWN INTO THE FIRES OF HELL!" 24 “No one can serve two masters. Either you will hate the one and love the other, or you will be devoted to the one and despise the other. You cannot serve both God and money. DURING THIS COURSE ON . . "THE NEW TESTAMENT" . . I LAID OUT . . . . "THE LOGICAL INCONSISTENCIES OF . . THE OLD VS THE NEW TESTAMENTS!" . . SUCH AS . . "LOVE YOUR ENEMIES!" . . AND "PRAY FOR THOSE" . . . . "WHO PERSECUTE YOU!" . . "SERIOUSLY!" . . NOT . . . . "LOVE YOUR NEIGHBOR!" . . AND . . "HATE YOUR ENEMY!" HAVING BEEN THE PRIMARY ALTER BOY (GIRL! OMG! HOW EVIL U PEPS R!) . . FOR THE MOST FAMOUS CATHOLIC PRIEST OF ALL TIME! . . . . FATHER CHARLES COUGHLIN! I READ MOST OF THE READINGS FOR HIM. . . FROM APROX 3RD TO THE 7TH GRADE! PLUS HAD AN ALTER AT HOME! . . PLAYING PRIEST OFTEN! . . I KNEW THE BASIS OF THESE . . . . "LOGICAL INCONSISTENCIES" . . BY THE TIME I WAS IN 7TH GRADE! AT THIS TIME . . IT WAS MATTHEW 25:31-46 . . "THE FINAL JUDGEMENT!" . . . . THAT I SPECIFICALLY REMBER THINKING . . "HE MUST BE GOD!" . . "WHO ELSE COULD BE SO . . THEOLOGICALLY PURE AND BRILLIANT!" ONLY ONE COMMANDMENT! . . "TAKE CARE OF . . THOSE IN NEED!" . . . . "NOT YOUR RUTHLESS PURE EVIL GREED FOR MONEY!" . . OR . . . . "FRY BABY FRY!" . . IN . . "THE VERY HELL OF ALL HELLS!" . . . . "YOUR PURE EVIL GREED CAUSED!" . . AS . . "WHAT EVER . . YOU DO!" . . AND . . "WHAT EVER . . YOU DON'T DO!" . . . . "TO THE LEAST OF THESE CHILDREN / PEOPLE!" . . "YOU DO TO ME!" . . AS . . "I AM ONE WITH EVERY ONE OF THESE BEAUTIFUL SOULS!" WHEN I GOT UP TO LEAVE ON THE LAST DAY OF THE COURSE! . . . . THE PROF/SISTER SAID . . JIM! I CAN'T WAIT TO HAVE YOU FOR . . . . "THE OLD TESTAMENT!" . . I HAVE NEVER KNOWN ANYONE THAT . . . . UNDERSTANDS . . "THE NEW TESTAMENT" . . "THE WAY YOU DO!" I SAID . . SISTER . . THERE IS A REASON THAT IT IS CALLED . . . . "THE OLD TESTAMENT!" . . CHRIST CAME DOWN TO SPECIFICALLY . . CLARIFY THE SIGNIFICANT NUMBER OF THEOLOGICAL ERRORS! AND "TO TEACH US HOW TO . . LIVE OUR LIVES . . ONE WITH GOD!" . . . . TO BE . . "THE PERFECT EXAMPLE!" . . AND . . TO KNOW THAT "YES" . . "GOD WILL FORGIVE YOUR FAULTS!" . . IF YOU . . "SINCERELY TRY!" . . TO . . "BE PERFECT! . . AS YOUR FATHER IN HEAVEN . . IS . . PERFECT!" . . IF . . "YOU FORGIVE OTHERS!" . . "THE WAY . . YOU WANT TO BE FORGIVEN!" . . "GOD'S SPIRIT . . WILL GUIDE . . THE PURE AT HEART!" . . EVEN THOSE . . . . "WHO ARE FAKING IT!" . . TO AT LEAST . . "TRY TO FOLLOW JESUS CHRIST!" NO MATTER . . "HOW EVIL!" . . "YOU HAVE BEEN!" . . "NOW!" . . IS THE TIME! . . TO BEG PASSIONATELY SINCERELY! . . "THAT GOD FORGIVES YOU!" . . SUPPORT . . "THE NORDIC MODEL!" GLOBALLY! FINANCIALLY & PUBLICLY! . . "GIFT YOUR . . INSATIABLE INSANE PURE EVIL WEALTH & INCOME!" . . TO . . "THOSE IN NEED!" . . "YOUR PURE EVIL GREED DAMNED!" THE LORD GOD! . . JESUS! . . SARAYU! . . MAMMA! . . AND FATHER! . . ARE VERY TOUCHED BY . . RADICAL AND ANY OTHER MEANINGFUL CHANGES! . . HENCE! . . "THE PRODIGAL SON STORY!" BUT . . "YOU" . . "MUST REPENT!" . . REPENT WITH PASSION! . . THEN . . "SUPPORT THE NORDIC MODEL!" . . AND . . GIFT YOUR EVIL GOTTEN WEALTH & INCOME TO THOSE IN NEED! "THE ONLY . . GOD OF LOVE!" . . "IS A . . SPIRIT!" WHICH IS HARD TO RELATE TO! SO GOD'S PRESENTS "GOD'S IMAGE!" AS . . "OUR PARENTS & GRANDPARENTS!" . . "THE SHACK" . . WAS VERY INSPIRED IN THIS PORTRAYAL! A MUCH MORE . . . . "LOGICAL" . . WAY TO RELATE TO ALL OF US! . . "AS OUR HEAVENLY PARENTS!" YOU CAN SEE THIS IN . . "THE HISTORY OF GOD'S RELATIONSHIP WITH US!" . . IN GOD'S OTHER . . "PERSONAS!" . . "MY AMAZING MOTHER!" . . . . "SARAYU!" . . "THE WHISPERER!" . . "THE WOMAN I DREAM OF BEING!" SOON! "THE LOGIC OF . . THE GOD OF LOVE!" . . IN EVERYTHING! . . "HUMANISM!" . . "NORDIC CHRISTIAN HUMANISM!" . . "SPECIFICALLY DENMARK & FINLAND!" "YOU WILL KNOW THEM . . BY . . THE FRUITS OF THEIR EFFORTS!" PLEASE SEE . . THE MOST IMPORTANT POST! . . ON . . "GOD'S SITE!" WELCOME TO "THE END OF THE WORLD!" "THANK GOD!" "It Is THE END!" PUTIN STARTS WWIII! 1 "THE FINAL JUDGEMENT" BY 2027! DURING "THE SECOND COMING!" MOST BLESSED - "CHRISTIAN NORDIC MODEL SUPPORTERS!" THE MOST DAMNED "THE EVIL RICH & RIGHT WING ANTI-CHRISTIANS!" "THE NORDIC MODEL!" . . "IS MOTHER'S AND MAMMA'S MATRIACAL MODEL!" . . SEEING AS . . "THE BOYS" . . AND . . MANY . . "GIRLS!" SEEM TO HAVE A . . . . "HARD TIME . . CONTROLLING" . . THEIR . . "TALLY WACKERS!" . . THEY . . "THINK WITH . . THE WRONG . . HEAD!" . . "JAZZIE SPEAKING!" . . THEIR . . "TESTOSTERONE DRIVEN GREED FOR MONEY POWER AND SEX!" "WHOOOO RA!" . . "YEA BABY CHRIST IS WHITE & RIGHT!" . . "MONEY IS GOD!" AS MY PROF FOR A DOCTORAL SYMPOSIUM IN POLITICAL ECONOMICS . . . . AS A SOPHOMORE AT THE UNIVERSITY OF UTAH TOLD ME WHEN . . . . I ASKED HIM . . SO KAY . .THEN HEAD OF THE UOFU ECON DEPARTMENT . . . . THERE ARE THESE UTOPIAN THEORIES OF UTOPIAN CAPITALISM . . . . UTOPIAN SOCIALISM / COMMUNISM AND THE NORDIC MODEL! THE UTOPIAN MODELS PROFESS THAT THE "ENLIGHTENED INDIVIDUALS" . . WILL RISE TO POWER VIA . . THE MARKET . . OR . . THE GOVERNMENT & . . WILL LEAD THE COUNTRY TO PROVIDE FOR . . "THOSE IN NEED!" . . WHICH DO YOU THINK IS THE BEST? . . KAY SAID . . JIM . . HAVE YOU READ ABOUT ANY . . "ENLIGHTENED INDIVIDUALS?" . . I SAID . . "NO . . THEY ALL APPEAR TO BE RUTHLESS MAFIA DONS!" . . HE SAID . . CORRECT! . . IT ALL COMES DOWN TO THE OLD SAYING . . "ABSOLUTE INCOME WEALTH AND POWER CORRUPTS ABSOLUTELY!" . . . . REGARDLESS OF WHETHER THE WEALTH IS OBTAINED THROUGH . . . . THE PRIVATE SECTOR OR GOVERNMENT. THE ONLY ONES THAT HAVE . . . . CHECKED THE CONCENTRATION OF WEALTH INTO A FEW HANDS . . . . "HONORING CHRIST'S ONLY COMMANDMENT . . TO BE SAVED!" . . "TAKE CARE OF THOSE IN NEED!" . . "NOT!" . . "YOUR EVIL GREED!" . . ARE . . . . THE NORDIC COUNTRIES! . . THEY ARE THE ONLY ONES THAT . . . . "TAKE CARE OF . . THE REST!" . . NOT JUST . . "THE RUTHLESS RICH!" CONCENTRATION OF WEALTH AND INCOME RESULTS IN A FEW PEOPLE . . . . HAVING ALMOST EVERYTHING! WHICH THEY WILL DO ANYTHING . . . . TO ANYONE . . WHO TRYS TO TAKE AWAY THEIR EVIL WEALTH & INCOME! AS HUMANS . . THERE IS SOME SENCE THAT . . "THE EVIL PEOPLE" . . . . "THAT CAUSED . . ABRUPT CLIMATE CHANGE . . DUE TO THEIR EVIL GREED!" . . CAUSING . . "GLOBAL GENOCIDE!" . . RECEIVED SOME OF THEIR IMPACTS! . . VERSUS . . PUERTO RICO! . . AND . . EMERGING MARKETS! . . . . THAT HAVE DONE NOTHING TO CAUSE . . "ABRUPT CLIMATE CHANGE!" REPUBLICANS RIGHT INDEPENDENTS & RIGHT DEMOCRATS CAUSED . . . . THE HORRIFIC "ABRUPT CLIMATE CHANGE" THAT WILL DESTROY LIFE ON . . . . PLANET RUTHLESS EVIL GREED! . . FOR THE BILLIONAIRES & THE RICH! ALL DENY . . "ABRUPT CLIMATE CHANGE!" . . DEMS ONLY PROPOSE TO . . . . SPEND A FRACTION OVER THE NEXT 10 YEARS! . . THAT HAS BEEN . . . . LOST OVER THE PAST FIVE YEARS! . . ON THE ONLY . . "6" . . CAT 4 & 5 . . SUPER STORM HURRICANES TO MAKE LANDFALL IN THE GULF! . . EVER! RIGHT WINGERS CONTINUE TO . . "DENY HUMAN CAUSED CLIMATE CHANGE!" . . "THEY TRY TO STOP ALL CLIMATE CHANGE MITIGATION SPENDING!" . . . . "THEIR PURE EVIL GREED CAUSED THIS HELL ON EARTH!" . . NOW . . "YE THAT WORK . . INIQUITY!" . . "THAT CHOOSE . . MONEY!" . . OVER . . "GOD!" . . THOSE THAT "STORED UP BILLIONS ON EARTH!" . . NOT . . "IN HEAVEN!" . . SUPPORTING . . "THE VIEL MAXIUM OF . . THE MASTERS OF THE UNIVERSE!" . . "ALL . . FOR US!" . . "NONE . . FOR . . THOSE IN NEED!" . . "FRY IN HELL!" "THE VERY HELL OF ALL HELLS" . . "YOUR EVIL GREED CAUSED!" WHAT A TRULY EVIL PEOPLE! I HOPE YOU FIND . . "TRUE CHRIST / GOD!" SOON! SATAN'S EMPIRE OF PURE RUTHLESS EVIL GREED DRIVEN INSANE RICH FUCKS! . . AND . . THEIR LUNATIC ANTI-CHRISTIAN SATAN'S MAFIA SLUTS! . . "MAY GOD HAVE MERCY ON YOUR SOULS!" . . "THE FINAL JUDGEMENT!" . . DURING . . "THE SECOND COMING!" . . BY 2025-2027! "THANK GOD!" . . "It Is THE END!" . . OF . . "RUTHLESS RULE BY THE EVIL RICH!" 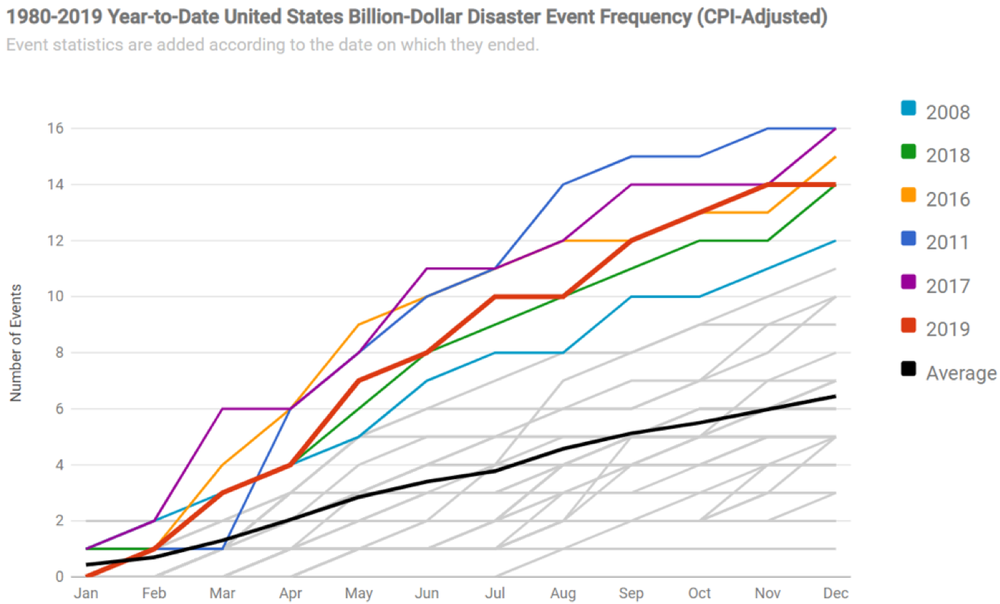 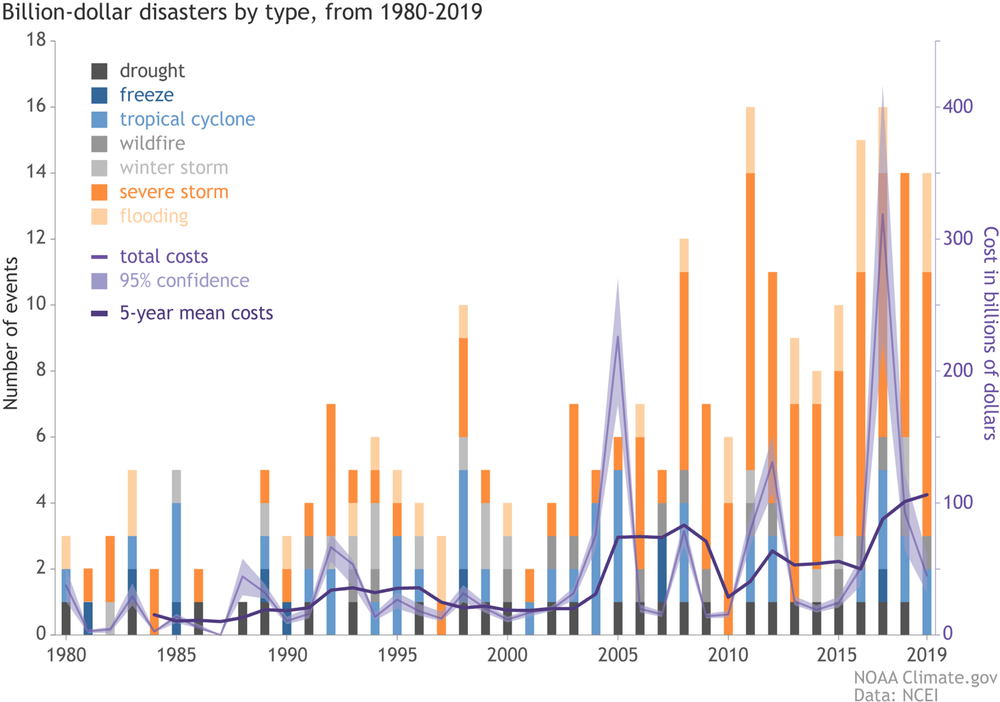 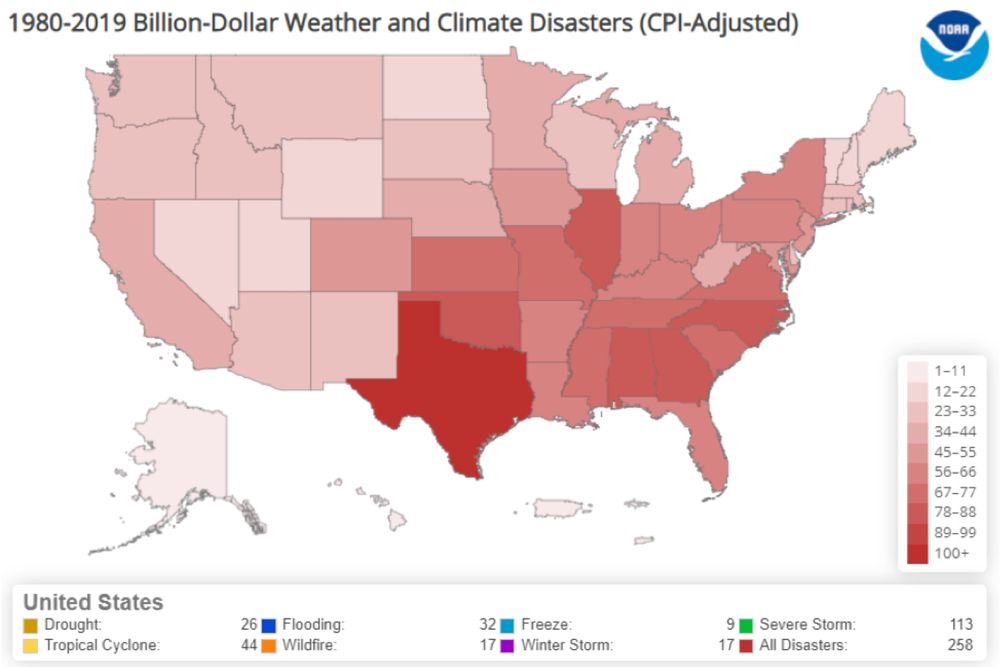 "SATAN'S MAFIA DON'S AND THEIR RIGHT WING ANTI-CHRISTIAN LUNATIC FOLLOWERS!" YOU RUTHLESS MONEY MONSTERS AND THEIR SLUTS . . COST THE US . . TRILLIONS! NOTABLY THE CAPITALS OF SATAN'S EMPIRE: TEXAS, FLORIDA, UTAH AND SE US! DUE TO . . "THE ABRUPT CLIMATE CHANGE" . . "YOUR EVIL GREED CAUSED!" AS MY PAPA, JESUS CHRIST, SAID . . "YOU WILL GET THE IMPACT OF YOUR WORDS AND DEEDS!" "THE HELL OF ALL HELLS ON EARTH!" . . "CAUSED BY THE ABRUPT CLIMATE CHANGE" . . "YOUR EVIL GREED CAUSED!" . . AND THAT . . "YOU DENY!" . . HAS JUST BEGUN! . . "YOU" . . "RIGHT WING DEMS, LIBERTARIANS AND REPUBLICANS!" . . WILL SUFFER IN . . . . "THE HELL OF ALL HELLS" . . "YOUR EVIL GREED CAUSED!" . . FOR ETERNITY! SAVE YOUR SOULS! . . SUPPORT . . "AS IT IS IN HEAVEN" . . "SO SHOULD IT BE ON EARTH!" "SUSTAINABLE HUMANE AND EGALITARIAN!" . . "THE SHE MATRIARCAL NORDIC MODEL!" 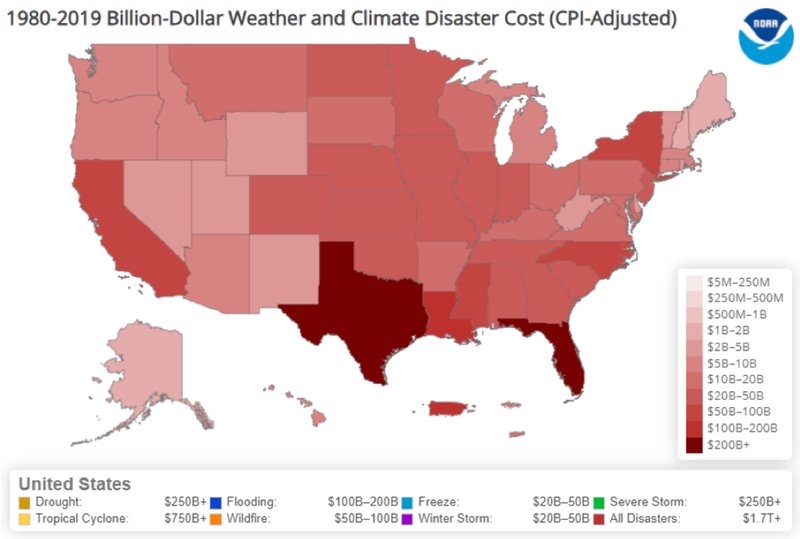
FLORIDIAN AND ALL RIGHT WING LOST AND EVIL SOULS! CATEGORY 4 & 5 LANDFALL STORMS IN . . "THE GULF!" RANKING BY SUSTAINED WIND SPEED AT LANDFALL: 1. 2020 "CAT 5 MICHAEL," 160 MPH, 919 MB! $25B, 45 DEAD! 2. 2022 "CAT 4 IAN," 150 MPH, 940 MB! E > 100B! > 77 DEAD! 2. 2021 "CAT 4 IDA," 150 MPH, 931 MB! $75 B! 107 DEAD! 2. 2020 "CAT 4 LAURA," 150 MPH, 939 MB! $19 B! 77 DEAD! 3. 2018 "CAT 4 IRMA," 130 MPH, 931 MB! $77B, 134 DEAD! 3. 2017 CAT 4 HARVEY, 130 MPH, 937 MB! $125B! 107 DEAD! "6" CAT 4-5 SUPER STORMS COSTING $ 421 BILLION! IN 5 Y! "ABRUPT CLIMATE CHANGE" . . COSTS . . TRILLIONS! Wildfire statistics
The High Cost of Drought January 23, 2020 Author NIDIS/NOAA NOAA’s National Centers for Environmental Information (NCEI) tracks U.S. weather and climate events that have great economic and societal impacts (www.ncdc.noaa.gov/billions). Since 1980, the U.S. has sustained 258 weather and climate disasters where the overall damage costs reached or exceeded $1 billion (including adjustments based on the Consumer Price Index, as of January 2020). Among these, 26 droughts cost the nation at least $249 billion, with an average cost of more than $9.6 billion incurred during each event. Only hurricanes were more costly. The cumulative cost for all 258 events exceeds $1.75 trillion. The number and cost of disasters are increasing over time due to a combination of increased exposure (i.e., values at risk of possible loss), vulnerability (i.e., how much damage does the intensity [wind speed, flood depth] at a location cause) and that climate change is increasing the frequency of some types of extremes that lead to billion-dollar disasters (NCA 2018, Chapter 2). Number of events The U.S. has experienced 69 separate billion-dollar disaster events over the last 5 years (2015-2019), an inflation-adjusted average of 13.8 events per year. Over the last 40 years (1980-2019), the years with 10 or more separate billion-dollar disaster events include 1998, 2008, 2011-2012, and 2015-2019. Increasing flood costs over next three decades will mainly impact people of color, study shows By Rachel Ramirez, CNN Published 11:00 AM EST, Mon January 31, 2022 The United States is already spending tens of billions of dollars a year on flood damage as hurricanes get more intense, sea level rises along the coasts and extreme weather becomes more frequent. And a new study suggests that not only is flooding going to cost the US even more in the future – around 26% more by 2050 – but people of color are going to bear the brunt of that increase. The study, published Monday in the journal Nature Climate Change, found the cost of flooding in the US will likely rise from around $32 billion today to $43 billion in 2050. And like many aspects of the climate crisis, the change in flood risk won’t affect everyone equally. THE ONLY . . "6" . . CATEGORY 4 OR 5 SUPER STORMS TO HIT THE GULF! . . . . ALL IN THE PAST FIVE YEARS! COST $421 BILLION! . . THESE 5 STORMS ALONE . . CAUSED . . 547 DEATHS! YET . . "BIDEN'S" . . "CLIMATE CHANGE BILL" ONLY SPENDS $375 BILLION! . .OVER 10 YEARS! YES . . RIGHT WING SATAN'S MAFIA DON DESANTIS! . . . . "6" CATEGORY 4-5 STORMS AT LANDFALL IN 5 YEARS! . . "IS BIBLICAL!" . . HENCE . . "THE FINAL TESTAMENT!" "It Is THE END" OF RUTHLESS EVIL RICH MONEY MONSTERS! . . STEALING EVERYTHING FROM EVERYONE! WHILE . . . . COMMITTING GLOBAL GENOCIDE BY THE . . . . "ABRUPT CLIMATE CHANGE" YOU EVIL MONSTERS . . . . CAUSED BY YOUR PURE EVIL GREED! . . AND DENY! "THE SECOND COMING" & "THE FINAL JUDGEMENT!" . . . . BY 2025-7! ENJOY THE HELL YOUR EVIL GREED CAUSED! . . BETTER SUPPORT "THE NORDIC MODEL" & GIFT BIG! NOW! LET'S SEE . . "6" . . "500 YEAR FLOOD EVENTS IN 5 YEARS!" . . NOT ANOTHER ONE FOR 3,000 YEARS! RIGHT THINKING! FROM . . NO . . CATEGORY 4 AND 5 SUPER STORMS! . . AT LANDFALL IN THE GULF! . . TO . .6 IN 5 YEARS! . . DUE TO SSTEMPS EXPLODING FROM HIGH 70S TO . . . . 83 F AT CENTER GULF BUOYS IN 2017! . . JUMPING TO . . 86.7 F JULY 2022! TO 85-90 F AT LANDFALL OF . . . . "SUPER STORM HURRICANE IAN" MAKES THE ODDS OF . . "THE MONSTER SUPER STORMS" . . THAT . . DESTROY! . . THE GULF, FLORIDA AND SE US NUCLEAR REACTORS! . . DUE TO SSTEMPS EXPLODING TO . . 90-100 F . . . . . . DUE TO . . "COMPLETELY ICE FREE ARCTIC" . . . . . . VERY LIKELY BY . . 2025 TO 2027! . . GET OUT NOW! PEOPLE DON'T REALIZE . . 82 F IS CAT 1 . . 86 F IS . . . . "TYPHOON HAIYAN!" 190 MPH, 220 T, MOST POWERFUL! THE EASTERN EYEWALL IS . . "THE DEVASTATION ZONE!" . . BY 2025 . . "THE MONSTER SUPER STORMS!" . . 220 MPH SUSTAINABLE WINDS! . . 270-300 MPH TOP! "THE MONSTER SUPER STORMS" DESTROY EVERTHING! . . DEVASTATION MORE THAN EASTERN EYE WALL! . . . . ALL THE WAY AROUND THE MASSIVE HURRICANE CONE! . . SIT ON TOP OF . . THE GULF, FLORIDA AND SE US . . . . NUCLEAR REACTORS! . . KAAA BOOM! . . "It Is THE END!" "THE MONSTER SUPER STORMS" DESTROY NUC REACTORS! . . BY 2025 - 2027! . . MOVE OUT NOW! . . DO NOT REBUILD! ALL CAT 4 & 5 LANDFALLS IN THE GULF OF MEXICO SINCE 8/2017 "WHEN JC TOLD ME HARVEY WILL A BE MONSTER!" . . CAT 4 OR 5 . . DUE TO . . 83 F SEA SURFACE TEMP! . . . . CENTER WEST GULF DEEP WATER BUOY! IT WAS 86.7 F! . . FROM JULY - SEPTEMBER! . . SST = 85-90 F FOR IAN! "JC CALLS" . . AUGUST 2017! SEE SUPER STORMS & POSTS! . . "THE BEGINNING OF THE ERA OF THE SUPER STORMS!" . . "THE BEGINNING OF THE END TIMES!" . . . . "THE CLATHRATE GUN FIRING" . . "HOT STUFF" ARISES! . . AND . . "THE GREATEST PROPHECY OF CHRIST!" . . . . BY 2025! . . DUE TO . . "COMPLETELY ICE FREE ARCTIC!" SEE PRIOR POSTS: HISTORIC HURRICANE SEASON POSSIBLE! "LA NINA" DRIVES HURRICANES WILDFIRES & GLOBAL FOOD SHORTAGES! METHANE CARBON EXPLODE! ATMOSPHERIC RIVERS MELT GREENLAND! "ICE FREE ARCTIC" 2025/7 = RAPID ICE MELT= AMOC COLLAPSE UNLEASHES "THE MONSTER SUPER STORMS!" THE LARGEST METHANE SEEP BELCHING 10 TONS OF METHANE PER DAY! THESE MASSIVE SEEPS WILL EXPLODE FROM BARENTS SEA TO THE EAST SIBERIAN ARCTIC SHELF! ALL OVER THE ARCTIC! WHEN THE ARCTIC IS ICE FREE! BY 2025-7! MELTING ANTARCTICA AND BURNING UP PLANET! "CHRIST'S MOST PROFOUND PROPHECY!" WHEN "THE ARCTIC IS ICE FREE!" "STRONG EL NINO COLLAPSE OF THE AMOC & THE 2ND COMING!" "BECOME ONE II!" TRANS HELL! PASSIONATELY LOVE GOD! NOT MONEY! "LOVE OTHERS WITH GOD'S LOVE!" GIVE YOUR WEALTH & LIFE TO GOD! 2021 ATLANTIC HURRICANE SEASON 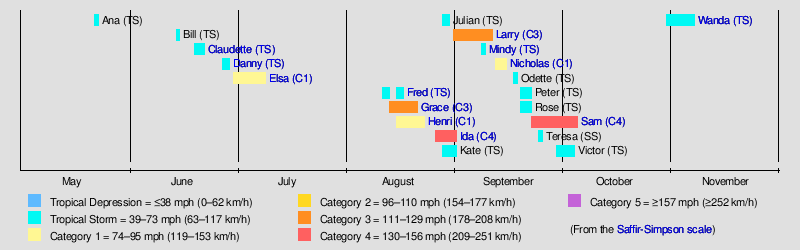    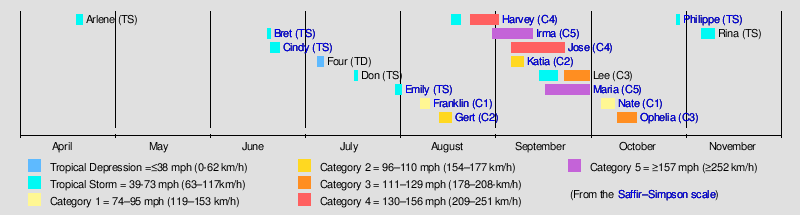 MASSIVE RAIN & HORRIFIC STORM SURGE! & HIGH WINDS! . . EQUALS . . DEVASTATION! . . BE SAFE! . . DON'T GO OUT! 85-90 F SEA SURFACE TEMPS = CAT 4-5 AS I FORECAST! . . AS A TROPICAL STORM! . . ONLY CAT 2-3 BY FORECASTS! 86.7 F IN DEEP WATER GULF! . . JULY - TODAY! . . 86 F! . . . . CREATED "TYPHOON HAIYAN!" 190 MPH, 220 T! LARGEST "SUPER STORM HURRICANE IAN" . . "150 MPH LANDFALL!" . . STRONGEST HURRICANE MAKING LANDFALL IN FLORIDA! . . "2ND FASTEST WINDSPEED HURRICANE TO HIT GULF!" CAT 4-5 = 17' OF STORM SURGE! ONLY 5-10' FORECAST! . . UPDATED SURGE FORECAST TODAY 12-18'! HAVE YOU LOST AND EVIL SOULS SEEN . . "SUPER STORM HURRICANE IAN!" . . NOT TO MENTION . . "SUPER STORM HURRICANE IRMA!" HAD IAN STAYED . . . . DIRECTLY PUSHING INTO . . "TAMPA BAY" . . MY BRO AND SIS' CONDO! THE TAMPA BAY! . . WOULD HAVE BEEN DESTROYED! . . HAD . . "IRMA!" . . NOT SLAMMED INTO CUBA! . . TURKEY POINT NUCLEAR REACTORS! . . . . MAY HAVE . . "IMPLODED AND EXPLODED!" DESTROYING . . REACTORS! . . PERMANENTLY DESTROYING LIFE IN FLORIDA, THE GULF & SE US! PLEASE SEE PRIOR POST: THE BAD NEWS ABOUT THE LACK OF DECLINE IN ARCTIC SEA ICE AND THE HORRIFIC NEWS ABOUT TOO MUCH BAD & TOO LITTLE CLEAN WATER! SECOND GLOBAL KILLER OF CROPS & PEOPLE! ABRUPT CLIMATE CHANGE LOCATIONS TO LIVE NEAR CLEAN FRESH WATER LOW RISKS TOP PICKS! MOVE OUT OF FLORIDA, THE GULF & SE US NOW! MOVE TO THE GREAT LAKES, EAST TO COAST, NORTH TO HUDSON BAY! PLEASE SEE THE PRIOR POSTS: HISTORIC HURRICANE SEASON POSSIBLE! "LA NINA" DRIVES HURRICANES WILDFIRES & GLOBAL FOOD SHORTAGES! METHANE CARBON EXPLODE! ATMOSPHERIC RIVERS MELT GREENLAND! "ICE FREE ARCTIC" 2025/7 = RAPID ICE MELT= AMOC COLLAPSE UNLEASHES "THE MONSTER SUPER STORMS!" "THE APOCALYPSE!" BY 2025-27! DUE TO "ICE FREE ARCTIC!" UNLEASHING "HOT STUFF!" "THE SIBERIAN METHANE MONSTER!" CHRIST'S MOST PROFOUND PROPHECY COMES TRUE! ONE DAY NORMAL! THE NEXT DAY! HELL ON EARTH! BY 2025-27! THE SECOND COMING! THE FINAL JUDGEMENT! THE MOST IMPORTANT POST ON CHRIST / GOD'S SITE: WELCOME TO "THE END OF THE WORLD!" "THANK GOD!" "It Is THE END!" PUTIN STARTS WWIII! 1 "THE FINAL JUDGEMENT" BY 2027! DURING "THE SECOND COMING!" MOST BLESSED - "NORDIC MODEL SUPPORTERS!" THE MOST DAMNED "THE EVIL RICH & RIGHT WING ANTI-CHRISTIANS!" HURRICANETRACK.COM, MARK SUDDITH! GREAT TRACKING! OR ON YOUTUBE!
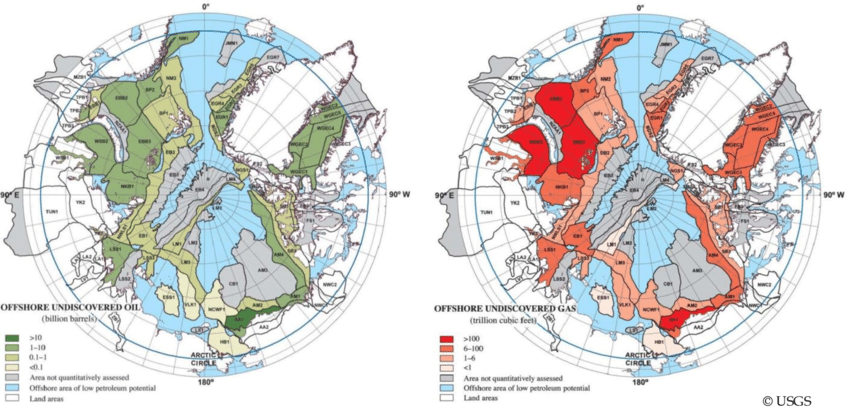 "THE OFFSHORE UNDISCOVERED GAS MAP" . . RED GAS MAP ON RIGHT ABOVE! . . . . "THE DARK RED" . . OVER 100 TRILLION CUBIC FEET . . OF GAS ESTIMATED . . . . ARE PRIMARILY AROUND . . THE YAMAL PENINSULA! . . WHICH LOGICALLY . . . . IS WHERE SCIENTISTS IDENTIFIED . . ROUGHLY 7,000 METHANE PINGOS . . . . ON THE YAMAL PENINSULA ALONE! . . THEY ESTIMATED 100,000 PLUS IN SIBERIA! "THE LARGEST RED AREAS" . . ARE . . IN THE BARENTS SEA AND THE KARA SEAS! OFFSHORE IN THE BARENTS SEA IS THE FOURTH LARGEST NATURAL GAS FIELD . . THIS IS THE MEGA FIELD THAT I THINK MAY . . EITHER BURST THE TOP ON! . . RESULT IN MANY . . VERY LARGE SEEPS! . . AND/OR IMPLODE . . LIKE HELLS GATE! . . "WHEN" . . "COMPLETELY ICE FREE ARCTIC" . . UNLEASHES . . "HOT STUFF!" . . "THE SIBERIAN METHANE MONSTER!" . . "THE CLATHRATE GUN FIRING!" . . "EXPLODING" . . SIBERIAN METHANE RELEASE! . . DUE TO ITS BARENT SEA LOCATION! Shtokmn field – 3.9Tcm Discovered in 1988, is located in the central part of the Russian sector of the Barents Sea, approximately 600km north-east of Murmansk and in water depths of ranging from 320m to 340m. THIS IS WHERE THE MASSIVE . . YAMAL NATURAL GAS MEGAPROJECT IS LOCATED! . . . . THE LARGEST YAMAL OIL FIELD IS Bovanenkovo field – 4.9Tcm THE GAS RESERVES ESTIMATE MAP SURELY PLACES THE LARGEST DEPOSITS! . . AROUND THE . . YAMAL PENINSULA AREA . . THE BARENTS AND KARA SEAS! . . HOWEVER THERE ARE SIGNIFICANT LIKELY DEPOSITS ALL THE WAY OVER TO . . . . "THE EAST SIBERIAN ARCTIC SHELF" . . AND . . THIS AREA IS SHALLOWER! . . INCREASING THE LIKELIHOOD OF METHANE REACHING THE ATMOSPHERE 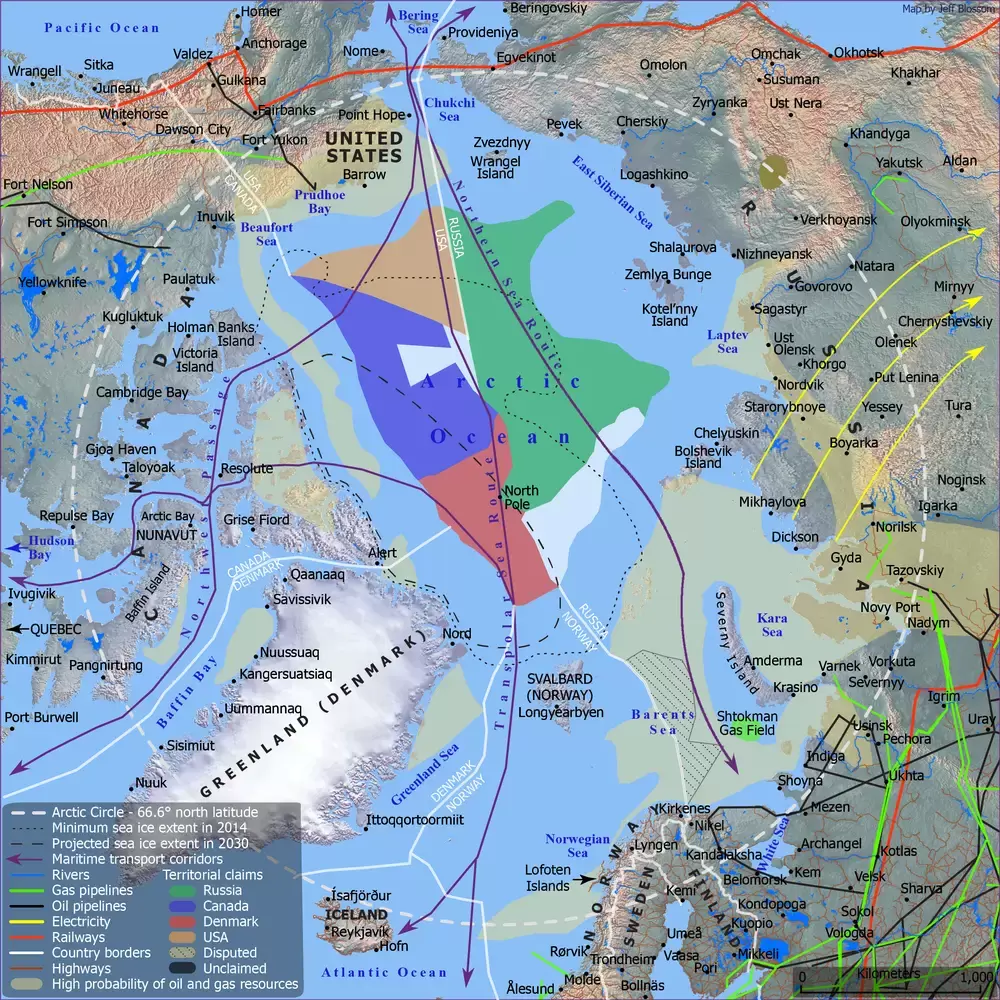  Fontana Village, a Baltimore-area apartment complex owned by Jared Kushner’s real-estate company, Kushner Companies. (Philip Montgomery for The New York Times) The Beleaguered Tenants of ‘Kushnerville’ CLICK! MUST READ! Tenants in more than a dozen Baltimore-area rental complexes complain about a property owner who they say leaves their homes in disrepair, humiliates late-paying renters and often sues them when they try to move out. Few of them know that their landlord is the president’s son-in-law. by Alec MacGillis May 23, 2017, 5 a.m. EDT  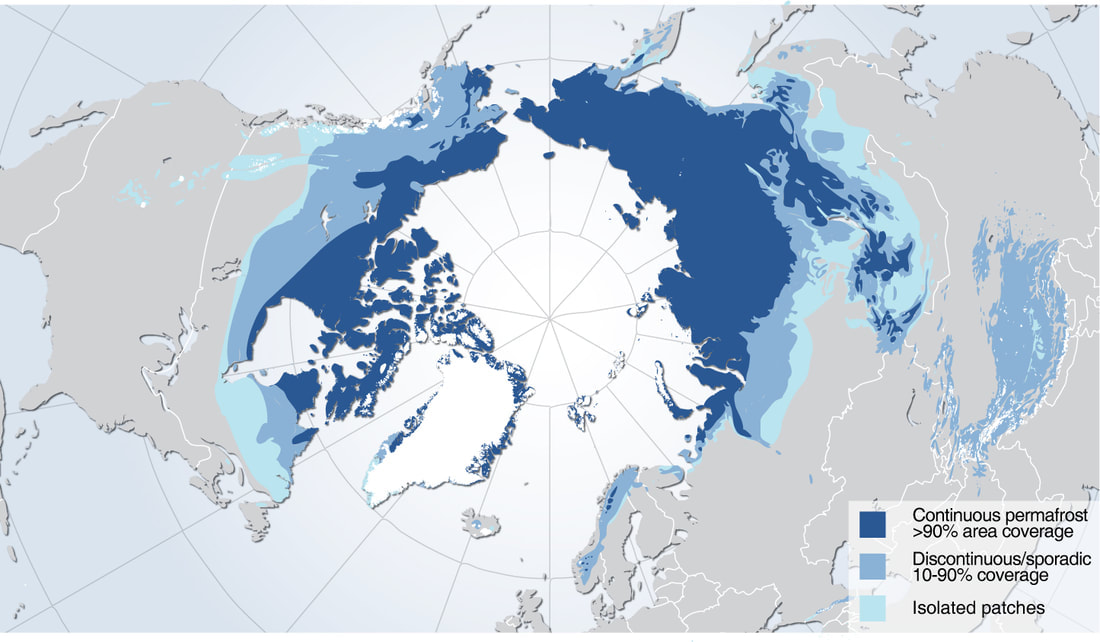
SIBERIA HAS THE MAJORITY OF THE . . "SIBERIAN METHANE MONSTER!" . . AS IT IS . . . . ALL MOST ALL DARK BLUE! . . CONTINUOUS PERMAFROST >90% COVERAGE! HOWEVER . . "HOT STUFF!" . . "THE SIBERIAN METHANE MONSTER!" . . PERMAFROST! . . IS FOUND ALL AROUND THE ARTIC CIRCLE, NOTABLY IN THE . . The Arctic Archipelago, also known as the Canadian Arctic Archipelago, is an archipelago lying to the north of the Canadian continental mainland, excluding Greenland (an autonomous territory of Denmark). Exceptional warming over the Barents area
Abstract In recent decades, surface air temperature (SAT) data from Global reanalyses points to maximum warming over the northern Barents area. However, a scarcity of observations hampers the confidence of reanalyses in this Arctic hotspot region. Here, we study the warming over the past 20–40 years based on new available SAT observations and a quality controlled comprehensive SAT dataset from the northern archipelagos in the Barents Sea. We identify a statistically significant record-high annual warming of up to 2.7 °C per decade, with a maximum in autumn of up to 4.0 °C per decade. Our results are compared with the most recent global and Arctic regional reanalysis data sets, as well as remote sensing data records of sea ice concentration (SIC), sea surface temperature (SST) and high-resolution ice charts. The warming pattern is primarily consistent with reductions in sea ice cover and confirms the general spatial and temporal patterns represented by reanalyses. However, our findings suggest even a stronger rate of warming and SIC-SAT relation than was known in this region until now. PLEASE SEE THE PRIOR POST ON HOW . . "THE BARENTS SEA" . . THE YAMAL PENINSULA! . . OVER TO . . "THE EAST SIBERIAN ARCTIC SHELF" . . WILL RELEASE . . . . TENS TO HUNDREDS OF GIGATONS OF METHANE HYDRATES . . WHEN . . . . "THE ARCTIC IS . . COMPLETELY ICE FREE!" . . DUE TO . . "THE LATENT HEAT EFFECT!" . . COUPLED WITH . . GIGATONS OF METHANE IN THE WATER COLUMN! . . WILL . . . . "EXPLODE THE METHANE RELEASE THAT IS MOSTLY IN THESE AREAS!" . . BUT . . ALL AROUND THE ARCTIC! NOTABLY THE . . CANADIAN/ARCTIC ARCHIPELAGO! HOWEVER . . MOST OF THE METHANE IS IN . . "THE BARENTS AND KARA SEAS" . . AND . . . . "THE YAMAL PENINSULA" SEE THE NATURAL GAS MAPS ABOVE & ON THE PRIOR POST! THE LARGEST METHANE SEEP BELCHING 10 TONS OF METHANE PER DAY! THESE MASSIVE SEEPS WILL EXPLODE FROM BARENTS SEA TO THE EAST SIBERIAN ARCTIC SHELF! ALL OVER THE ARCTIC! WHEN THE ARCTIC IS ICE FREE! BY 2025-7! MELTING ANTARCTICA AND BURNING UP PLANET! STARVATION DUE TO CROPS BURNING UP & FLOODING! THE 3RD GLOBAL GENOCIDE KILLER! A BRUTAL WAY TO GO! WET BULB TEMPS, NO FRESH WATER OR FOOD! THE BIG THREE KILLERS! MONOPOLIST NAZI SLAVE OWNER'S DARK MONEY'S $1.6 BILLION SUPREME INJUSTICE POLITICAL BUYOFF! THE BAD NEWS ABOUT THE LACK OF DECLINE IN ARCTIC SEA ICE AND THE HORRIFIC NEWS ABOUT TOO MUCH BAD & TOO LITTLE CLEAN WATER! SECOND GLOBAL KILLER OF CROPS & PEOPLE! ABRUPT CLIMATE CHANGE LOCATIONS TO LIVE NEAR CLEAN FRESH WATER LOW RISKS TOP PICKS! 2025-7 "THE FIREY WAVES OF DEATH!" "WET BULB" TEMPS DRIVEN BY "HOT STUFF" INSURES 3-4 BILLION DEATHS 2 YEARS FROM "ICE FREE ARCTIC!" THE POOR DIE QUICKLY! THE REST EXIT PEACEFULLY OR NOT! RICH & WHORES FRY IN HELL! SATAN'S ANTI-CHRISTIANS! EVIL NOT GOD! Introduction Changes in surface air temperature (SAT) and sea ice are the main drivers of the ongoing environmental transformation of the Arctic1 and have emerged as a leading signal of the global warming2,3. For more than four decades, the Arctic sea ice extent has declined almost continuously, with the largest trends in September and the smallest in March3. Between 1979 and 2021, the September trend was − 13.4% per decade, while the March trend was − 2.6% per decade4. In addition, the sea ice trend is accelerating for all calendar months, meaning larger losses towards present time5. The Arctic SAT for 2020 marks the 9th of the last ten years when SAT anomalies were at least 1 °C higher than the 1981–2010 average6. The Arctic climate is trending away from its 20th-century state and into an unprecedented state with accelerated warming since 20057. The long-term Arctic instrumental SAT records show an annual warming rate that has increased from 0.3 °C per decade over the period 1951–2015 to 0.9 °C per decade over the period 1996–20158. According to the fifth generation European Centre for Medium Range Weather Forecasts atmospheric reanalysis of the global climate (ECMWF-ERA59), the Arctic SAT warming rate is about 0.6 °C per decade within the period from 1971 to 2019, which is three times as fast as the global average7. Both the SAT analysis from instrumental records8 and widely used reanalyses products, including ERA5, point to a maximum warming area in the Barents region (Fig. 1). This Arctic warming hotspot10 is not constrained to the warming atmosphere; the Northern Barents Sea (NBS) region also hosts the most pronounced loss of Arctic winter sea ice11 and has since the early 2000s experienced a sharp increase in both temperature and salinity in the entire water column. The decline in the Barents sea ice cover, increased ocean temperature and salinity are closely related to the higher temperatures in the Atlantic Water and increased ocean heat transport entering the region from the west12,13,14. In addition, the increase in salinity is larger towards the upper layers, leading to a weakened ocean stratification and hereby an increased upward heat flux10. These oceanographic processes strongly contribute to the amplified warming in the region and enable larger heat flux interaction between the ocean and the air. If the rise in ocean temperature and salinity continues, the originally cold and stratified Arctic shelf region may be transformed into an Atlantic-dominated climate regime with a warmer and more well-mixed water column strongly preventing sea ice formation10. However, the Barents sea ice cover is largely affected by sea ice transported from the Arctic Ocean, and events of sudden enlarged sea ice or freshwater influx to the region may revert or postpone this Atlantification14,15. Figure 1 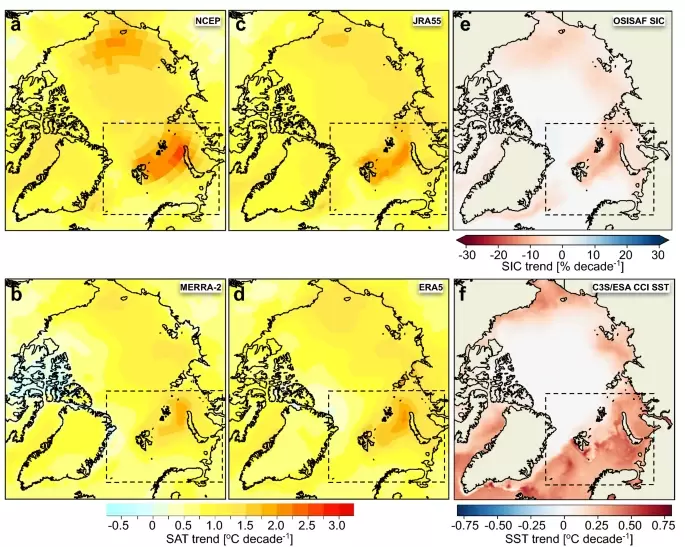 Spatial pattern of the Arctic warming and sea ice decline. (a)–(d) show trends in annual SAT (°C/decade) during the 1981–2020 period derived from various reanalyses sources (see Methods) that have been widely used for the Arctic: (a) NCEP-reanalysis, (b) MERRA-2, (c) JRA55 and d) ERA5. (e), (f) show annual trends in SIC (%/decade) and SST (°C/decade) (EUMETSAT OSI SAF, C3S/ESA SST CCI). The Barents study area is marked with dotted lines. We used the esd R-package (https://doi.org/10.5281/zenodo.29385) to create the maps in (a–d). The maps in (e–f) were generated using Python 3.6 (http://www.python.org) including pyresample 1.19 and cartopy 0.18. Although the recent changes in ocean climate and sea ice in the NBS have been well documented in a number of publications in recent years14,16,17,18,19,20, there have been few studies on systematic changes in SAT based on instrumental observations, especially in the northern and eastern NBS. From long-term instrumental observation series high positive temperature trends were observed in the Svalbard region connected to the “early twentieth century warming”21, e.g. an annual warming during 1920–1942 of 0.3 °C per decade and a winter warming of 1.2 °C per decade22. However, these studies were limited to the western and southern part of the region. In more recent decades, various reanalyses and instrumental long-term series have shown distinct spatial differences in the SAT warming pattern within this region. Further, the most recent assessment on instrumental observations in the Arctic shows the largest temperature increase over western Svalbard8. However, this is based on a very limited data set for the NBS. On the other hand, various reanalyses that have been widely used for the Arctic (Fig. 1) indicate that the largest warming takes place near Franz Josef Land and Novaya Zemlya in the northeast7,23. Furthermore, the annual warming from ERA5 of 1.6 °C per decade in the northeast7 is significantly greater than 1.0 °C per decade over western Svalbard, seen in instrumental observations after they have been adjusted for the same period 1971–20198,24. The scarcity of available near-surface in-situ observations in the region makes reanalyses more dependent on model assumptions compared to more data-rich regions, and it both hampers the validation and reduces the confidence of the reanalyses in this region. Recently, it has been shown that a warm bias is present at the surface and over sea ice in most reanalyses25,26,27,28,29,30. On Svalbard, most of our knowledge about SAT development is based on long-term instrumental observation series limited to the western and southern part of Svalbard22,24,31,32,33,34,35,36. To our knowledge, the SAT development of northern and eastern Svalbard remains unexplored34. In this study, we compile and analyze a large dataset on instrumental SAT observations from the archipelagos Svalbard and Franz Josef Land (FJL), located on the border between the Barents Sea and the Arctic Ocean (Fig. 1). This new dataset covers the period 1981–2020, has unprecedented spatial coverage, and provides time series that are longer than those that have been used by the scientific community so far. Indeed, some of the data series have not previously been available for scientific analysis. The quality of the SAT series has been improved further by extensive quality control and metadata from the archives. Here, they are compared with the SAT data from the most recent ECMWF reanalysis data set (ERA59) and the recently released high-resolution Copernicus Arctic Regional ReAnalysis (CARRA37) from Copernicus Climate Change Service (C3S). The SAT trends have been evaluated against sea ice concentration (SIC) and sea surface temperature (SST) data from global data sets (EUMETSAT OSI SAF and ESA SST_cci, respectively) and high-resolution ice charts (MET Norway). Our main objectives are threefold: i) establish an extended and consistent high-quality SAT-dataset covering the NBS region, ii) study the recent warming and its spatial and temporal variability over the NBS, and iii) relate the trend in SAT pattern to variations in SIC and SST. Specifically, we address and discuss the following questions:
We find an unprecedented increase in SAT over the NBS of up to 2.7 °C per decade annually at Karl XII-øya in northeastern Svalbard, with a maximum in autumn of up to 4.0 °C per decade. The warming is greater than hitherto known in this region and exceptional on the Arctic and global scale. We show that the warming is strongly linked, both in space and time, to the large reduction of sea ice and increased SST and that the observed temperature increase is in good agreement with the reanalysis. Our results additionally demonstrate that while CARRA and ERA5 reproduce the gross features of the observed trends, CARRA does it with more spatial details and larger regional SAT trends. Results Recent surface air temperature (SAT) developmentSAT development from reanalysesOur initial analyses were based on a suite of global reanalyses and show that the increase in the Arctic SATs over the period 1981–2020 was not spatially uniform. In general, higher positive SAT trends occurred in the marginal seas of the Arctic Ocean with seasonally ice-covered sea. The trends were strongest in the NBS, with an annual warming rate generally between 1.2 °C and 2.0 °C per decade, depending on the reanalysis product (Fig. 1a–d). The maximum annual warming occurred in a zone between FJL and Novaya Zemlya (for location see Fig. 2a) with values ranging from 1.8 °C (Fig. 1b) to 2.5 °C (Fig. 1a) per decade. Here also the largest decline in SIC (Fig. 1e) was observed, with a reduction of up to 16% per decade. Finally, the trends in SST were also pronounced in the Barents area, with the highest trends of 0.5 to 0.6 °C per decade found south of and along the west coast of Svalbard and in the central and south-eastern areas of the Barents Sea (Fig. 1f). Figure 2 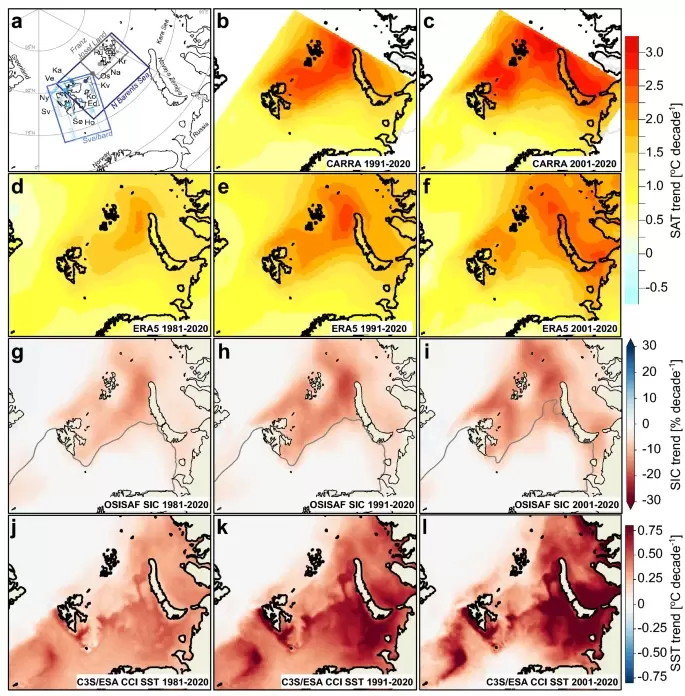 The spatial pattern of changes in surface air temperature, sea ice and sea surface temperature in the Barents study area for the time periods 1981–2020, 1991–2020 and 2001–2020. (a) Barents study area including the 13 weather stations which are shown with symbols and the first two letters of the station name from Fig. 3b (for larger map and more details, see Fig. S1). The regional boxes used for time series analyses (Table 1 and 3) are marked on the map, including the four Svalbard sub-regions. (b)–(f) Annual SAT trends (°C/decade) derived from CARRA and ERA5. Please note that the results are mapped onto different grid resolutions. (g)–(i) Annual trends in SIC (%/decade) with mean 15% SIC (ice edge) contour line marked in grey, and (j)–(l) present the annual SST trends (°C/decade) during the three periods. We used the esd R-package (https://doi.org/10.5281/zenodo.29385) to create the maps in b-f. The maps in a, g-l were generated using Python 3.6 (http://www.python.org) including pyresample 1.19 and cartopy 0.18. CARRA and ERA5 reanalyses have been used in the further analysis of the Barents study area, and we performed detailed analysis in the following three main regions; Svalbard, Northern Barents Sea (NBS) and Franz Josef Land (FJL) (Fig. 2a). ERA5 showed higher warming rates in the periods 1991–2020 and 2001–2020 compared to 1981–2020, and the most pronounced warming took place in the eastern NBS and northeast of Svalbard (Fig. 2b–f). However, CARRA showed notably greater regional SAT trends compared with ERA5. While ERA5 shows an annual warming rate of up to 2.5 °C per decade in both periods, the highest warming rate found for CARRA is 3.1 °C per decade (Fig. 2b–f). The hotspot in ERA5 primarily occurs in a zone between FJL and Novaya Zemlya, but CARRA has in addition a distinct hotspot area between northeastern Svalbard and FJL, especially in the period 2001–2020 with warming rates between 2.5 and 3.0 °C per decade. SAT development from instrumental observationsWithin the study area (Fig. 2a), two long-term composite series have been established for Svalbard Airport24 in the west and the Krenkel Observatory38 in the northeast (Fig. 3a). Both highlight the unprecedented high temperatures of the twenty-first century and the recent warming rate that is stronger and longer lasting than during the “early 20th-century warming” (cf. Førland et al.22). The annual average temperature for all 13 stations in the study area was compiled for the years they are operated, during 1981–2020 (Fig. 3b). There is an annual temperature difference of more than 10 °C between the coldest stations on FJL and the warmest stations on Svalbard, thus they cover most of the temperature range identified by the reanalyses in the region. Figure 3 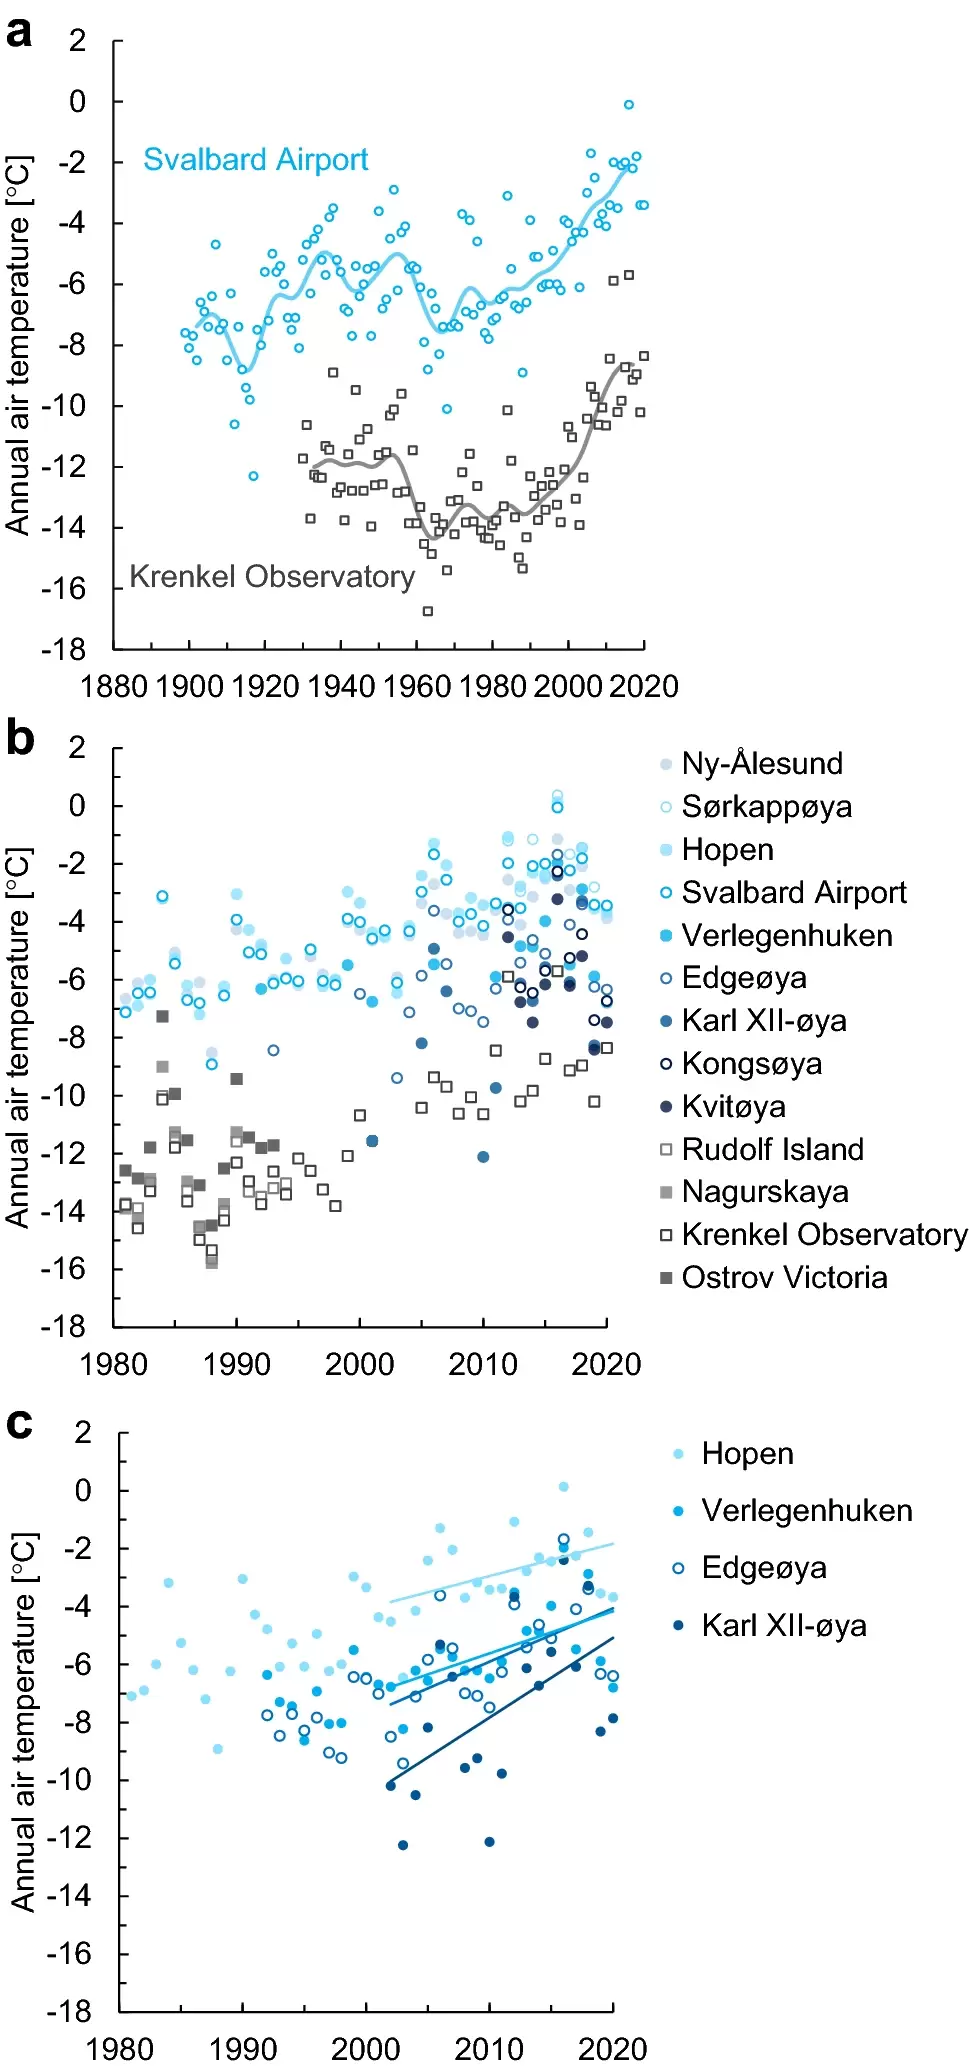 Temperature series from weather stations and observed trends. (a) Annual SAT series from the manned stations at Svalbard Airport24,31 and Krenkel Observatory38. (b) Annual SAT 1981–2020 from both old and newly available observations from Norwegian (in blue) and Russian (in grey) weather stations. (c) The new SAT series from the automatic weather stations at Verlegenhuken, Edgeøya, and Karl XII-øya compared with the manned station at Hopen. The data in a were filtered by a Gaussian filter with a standard deviation of three years, which illustrates variability at a decadal scale. In c linear trends for the 2001–2020 period are shown as solid lines. Values for the linear trends and statistical significance can be found in Table 1. The new instrumental series from northern and eastern Svalbard at Verlegenhuken, Edgeøya and Karl XII-øya (for location see Fig. 2a) were compared with the well-established series from Hopen at south-eastern Svalbard (Fig. 3c). Compared with Hopen, the trend is stronger for all three sites, especially in the recent period 2001–2020. Trend values from the three new series were compared with our four longest time series (Table 1). From 1981 to 2020, our observed station-based data showed an annual warming rate varying between ~ 1.0 °C and 1.6 °C per decade. Record-high warming was observed over the two periods 1991–2020 and 2001–2020, with annual values ranging from ~ 1.1 °C per decade in Ny-Ålesund to 2.7 °C per decade at Karl XII-øya (Table 1 and Fig. 3c). The annual warming was dominated by higher autumn and winter warming but enhanced warming occurred in all seasons (Table 1). In autumn (SON) we noticed an accelerated warming for 1991–2020 and 2001–2020, with up to 4.0 °C per decade for the latter period at Karl XII-øya. In winter (DJF), the highest trends (up to 3.8 °C per decade at Krenkel Observatory) were found for the period 1991–2020. In spring (MAM) the highest trend was observed at Krenkel Observatory, with 2.1 °C per decade during the latest period 2001–2020. All stations showed low or moderate warming rates during summer (JJA), with values ranging from 0 to 0.7 °C per decade. The exception was Karl XII-øya, with a summer warming rate of 1.3 °C per decade during 2001–2020. Table 1 Linear temperature trends (°C/decade) based on instrumental observations and CARRA and ERA5 reanalysis. The annual trends were nearly all statistically significant at the 1 or 5% level for the three periods (Table 1). For 1981–2020 and 1991–2020, they were statistically significant at the 1% level. For most stations, seasonal trends were statistically significant at 1% or 5% level for the two longest periods. For 2001–2020, most of the SON trends were significant at the 1% level but for the other seasons either significant at the 5% level or not significant. Comparing observed SAT trends with reanalysesThe warming seen in the instrumental observations (Table 1) is generally consistent with the spatial and temporal patterns found in the reanalyses. SAT increased in the entire area. The SAT trends were highest in the east and north and lowest in west and south. In the longest period 1981–2020, there was a good agreement between the four observed series and ERA5 (Figs. 4 and S6). For the 1991–2020 period there was also a reasonable agreement between observed trends and both reanalyses. The exception was Edgeøya and partly at Verlegenhuken, where CARRA indicated larger warming than observed (0.5 °C and 0.1 °C higher, respectively). For the period 2001–2020, observations are closer to CARRA than ERA5 at Verlegenhuken, Edgeøya and Karl XII-øya (Figs. 4 and S6). At Karl XII-øya, observed trends are larger than trends from CARRA. For the two latter periods, there is a striking difference between CARRA and ERA5. CARRA generally indicates larger warming rates (of up to 2.6 °C per decade at Ostrov Victoria) than ERA5 for the northern and eastern sites (cf. Figure 2). For the three southwestern stations Hopen, Sørkappøya, and Svalbard Airport, the trends were somewhat larger in ERA5 than in CARRA. Hence, CARRA clearly shows higher spatial variations in the trends than ERA5. Figure 4 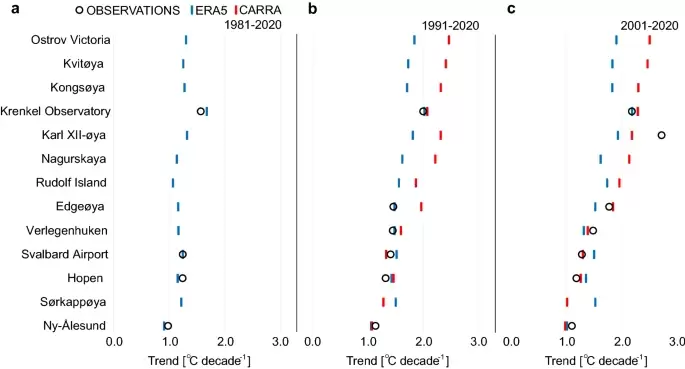 Annual trends in surface air temperature compared with reanalyses. Estimated SAT trends from observations (circles), ERA5 (blue bars) and CARRA (red bars, only in b and c) for the three different time periods: (a) 1981–2020, (b) 1991–2020 and c 2001–2020. The order of stations follows the ranked annual trends computed from CARRA reanalysis for the period 2001–2020. Similar results but for seasonal values can be found in Fig. S6. Evaluation of ERA5 and CARRA reanalysesThe newly established station series from Karl XII-øya, Edgeøya, and Verlegenhuken provide a possibility to assess CARRA and ERA5 reanalyses with new observations that were not available during their production. The results were summarized in terms of biases and Standard Deviations of Error (SDE) in Table 2. It should be noted when comparing reanalysis (grid values) with point observations that some of the differences are due to what they represent and not necessarily errors in the data sets. For CARRA, the biases increase substantially at Karl XII-øya for the period without available observations. However, at Edgeøya and Verlegenhuken the biases are more similar for the two periods. For ERA5, the biases at Karl XII-øya and Edgeøya (NDJFMA only) are substantially higher for the periods where the observations are not available. Furthermore, both reanalyses show higher SDE at all three sites when no observations were available compared to when they were available. However, the availability of observations alone is not enough to ensure that they are assimilated in the reanalyses. For example, adjustments of surface temperatures, based on SAT through the surface assimilation process, are only done for the land part of a grid cell, and in ERA5 only if the land part is larger than 50%9. Due to this protocol, local observations of SAT were used at Verlegenhuken and Edgeøya in CARRA, but at Karl XII-øya, which is an ocean point in both reanalyses, the observations were not used in the assimilation process. The same applies to Edgeøya and Verlegenhuken in ERA5 (land part less than 50%). The change in the deviation between the reanalyses and the observations for these sites must therefore be explained otherwise. The mean temperatures, given in Table 2, differ substantially between the periods and support the idea that temporal variations in weather conditions may be the reason for these differences. The SAT in periods without available local observations is on average 6.9 °C, 3.3 °C and 0.9 °C lower for Karl XII-øya, Edgeøya, and Verlegenhuken, respectively. The deviations from the observations in Table 2 for CARRA are consistently similar or lower than the deviations for ERA5 and the results are therefore in good agreement with the general picture on how CARRA adds value to ERA539. Even if both reanalyses show a high correlation with in-situ observations, CARRA shows higher correlations than ERA5, especially for the warmest months May–October (Fig. S5). Obviously, ERA5 produces some of its highest correlations with the observations at Krenkel Observatory and Ny-Ålesund which are the only two SAT observation sites that are assimilated in ERA5 in the region. Table 2 Summary of SAT biases and Standard Deviation of Error (SDE) in the CARRA and ERA5 data sets at three observation sites (Karl XII-øya, Verlegenhuken, and Edgeøya) for the period 1998–2018. Additionally, we compared CARRA and ERA5 with observed SAT from ten observation sites, stratified by the nearby sea ice conditions (Table S3). For all sites, the SDE was higher when close ice (SIC > 70%) was present compared to open water (SIC < 10%). The absolute biases were on average only slightly larger for close ice than for open water for both reanalyses, but some locations (e.g. Karl XII-øya) were highly sensitive to the sea ice conditions. Furthermore, the frequency of close or mixed ice (SIC = 10–70%) at Karl XII-øya was higher in the period without available SAT observations (mean SIC = 79%) than in the period with available SAT observations (mean SIC = 50%) and can explain a substantial part of the differences in bias and SDE for Karl XII-øya seen in Table 2. Thus, a pronounced warm bias for close ice conditions was observed. Averaged over all sites, CARRA has a lower absolute bias than ERA5 independent of close ice (0.6 °C) or open water (0.7 °C) conditions. Trends in SIC and SSTSIC and SST development from remote sensing observationsThe sea ice has declined since 1981 in the entire Barents study area (Figs. 2, 5). The strongest decline occurred over the shelf region north of the mean ice edge (Fig. 2) in the NBS with pronounced sea ice reductions in the area between FJL and Novaya Zemlya, and in the area north and east of Svalbard. Similar to the warming pattern, the decline in SIC was more pronounced during the periods 1991–2020 and 2001–2020 than during the entire 40 years period (1981–2020). Figure 5 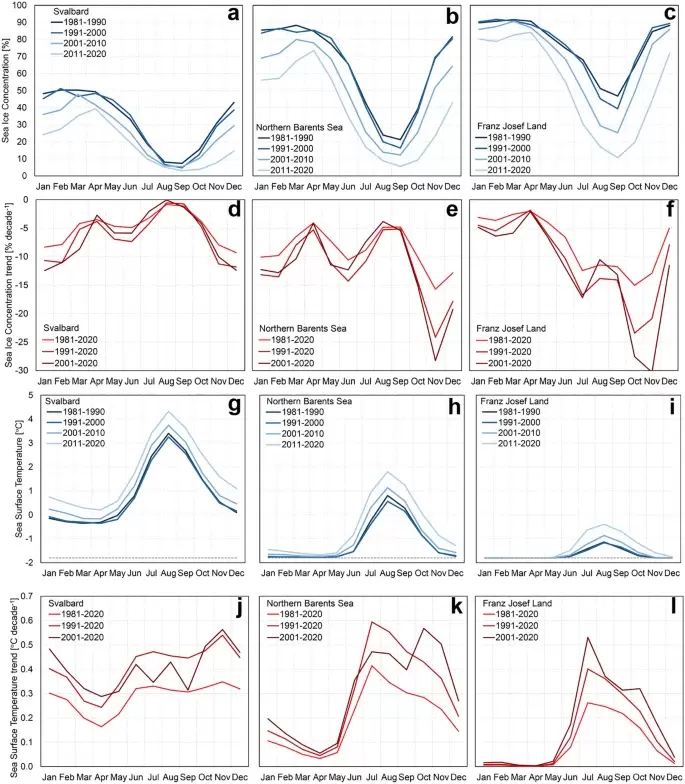 Decadal monthly mean sea-ice concentration and sea surface temperature and trends. Monthly decadal mean SIC and SST for Svalbard (a), (g), Northern Barents Sea (b), (h) and Franz Josef Land (c), (i) (see Fig. 2a). Estimated linear trends for SIC (d)–(f) and SST (j)–(l), respectively, for the same areas and for the three study periods. The Svalbard region is largely affected by the warm Atlantic Water, making the western part mostly ice-free year-round (Fig. S7) and the whole region is close to ice-free during mid-summer (Fig. 5a). The largest decline has occurred in winter (Fig. 5d) where the mean SIC has decreased from 40 to 50% in the 80 s to 15–25% in the period 2011–2020 (Fig. 5a). The NBS and FJL regions have a generally higher mean SIC throughout the year and with winter SIC (November to May) well above 70% in the 80 s and 90 s (Fig. 5b–c). The NBS SIC has dropped by 5–15% per decade for all seasons, except for November when SIC decreased by more than 23% per decade during the last three decades and more than 27% the recent two decades (Fig. 5e). In FJL, the least decline in sea ice was during winter, however, a strongly reduced ice cover has occurred for the months from June to November with a pronounced and increasingly faster reduction in October–November (Fig. 5f). The SST trends are overall positive in the Barents study area with the highest warming rates generally found in the third period (2001–2020) along the two branches of the Norwegian Atlantic Current. One of the branches flows along western Svalbard and the other crosses the Barents Sea towards the Arctic Ocean between FJL and Novaya Zemlya (Figs. 2j–l, 5j–l). Of the regions analyzed here, Svalbard west (Fig. 2a) had the highest trends with up to 0.8 °C per decade annually and 1.0 °C per decade in spring (Table 3). Svalbard south, related to the bathymetric trough Storfjordrenna (just south of the station Sørkappøya), also showed an accelerated warming trend (Fig. 2j–l). In the Barents Sea, a very strong warming (up to 0.8 °C per decade) occurred in the southeastern region just outside of the mean ice zone. Furthermore, the southwestern Kara Sea within the mean ice zone experienced a strong warming especially in the last two decades. The weakest SST trends were found for the FJL region ranging from nearly 0 °C per decade in winter and spring to 0.3–0.4 °C per decade in summer and autumn for 2001–2020 (Table 3). Table 3 Trends in sea ice concentration and sea surface temperature. Full size table Observed warming related to sea ice and SSTThe spatial pattern of SIC trends resembles very much the SAT trends pattern across the Barents study area (Fig. 2). Figure 6a shows the scatter plot of annual SAT values from the 13 weather stations as a function of the annual SIC in the adjacent sea region (50 × 50 km) extracted from the high-resolution NIS ice charts. The values align well relating low SIC with higher SAT values and vice versa. The FJL stations, typically located further away from the sea ice edge, show a slightly steeper regression between SAT and the ice cover than the Svalbard stations, which more often are surrounded by less dense ice cover. Figure 6 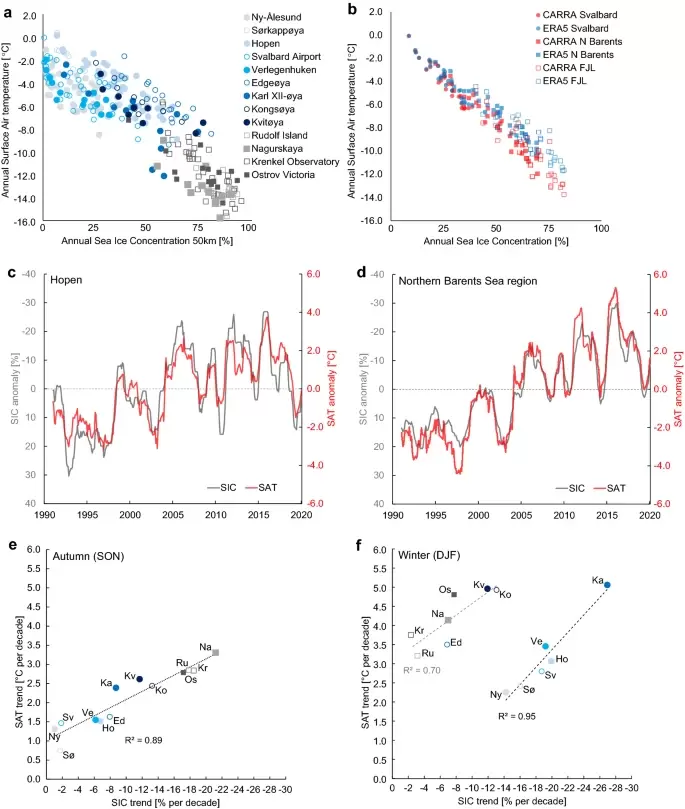 Correlation between sea ice concentration and surface air temperature. (a) Scatter plot between the annual SIC (calculated from 50 × 50 km boxes) and the annual SAT observed at the weather stations for 1981–2020. SAT data are original values only (no interpolations). (b) Scatter plot between the regional annual mean SIC (OSI SAF data) and SAT (from CARRA and ERA5) calculated from regional boxes (cf. Figure 2a) for the period 1991–2020. c 12-month running mean SIC- and SAT-anomalies for Hopen, based on the SIC 50 × 50 km boxes (NIS-dataset) and instrumental observations, respectively. The anomalies were computed with respect to the 1991–2020 mean. (d) Same as in c but for the NBS region, based on OSI SAF and CARRA datasets, respectively. (e) Scatter plot between 1991–2020 trends in SIC (calculated from 50 × 50 km boxes) and SAT from the weather stations for autumn (SON). (f) Same as in e but for winter (DJF) with regression lines for stations located in “Svalbard south, west and north” and “Svalbard east and FJL”. In (e) and (f) CARRA series at station locations is used for gap-filling where SAT data are missing in part of the series for Sørkappøya (Sø), Karl XII-øya (Ka), Kongsøya (Ko), Kvitøya (Kv), Rudolf Island (Ru), Nagurskaya (Na) and Ostrov Viktoria (Os). Stations are shown with symbols and the first two letters of the station name from (a). On a regional scale, the annual SAT derived from both CARRA and ERA5 relate to the annual regional SIC (OSI SAF data) in the same manner as for the station observations (Fig. 6b). However, for the FJL and NBS regions, a stronger disagreement can clearly be seen between the two reanalyses for higher values of SIC (SIC > 50%), with lower SAT values for CARRA compared to ERA5. The lower CARRA temperatures over high SIC for the FJL and NBS regions correspond better with the observed SAT from the associated stations (Fig. 6a). Both the long-term trend and the interannual variability show high compliance between the 12-month running mean of SIC versus SAT both locally and regionally (Fig. 6c,d). Similar high compliance was found for the two other main regions of Svalbard and FJL. From these time series, the signature warming peaks stand out very clearly for 2006, 2012, 2016 in both SIC and SAT, indicating the absence of a clear temporal lag between the two geophysical properties of sea ice and air temperatures. Taking into account all 13 station locations, we find that the trends of the annual SAT relate well with the trends of annual SIC (R2 ~ 0.5 where R is the Pearson correlation coefficient). It is, however, the autumn and winter seasons that account for most of the high correlation between changes in SAT and SIC. Interactions between local SIC and SAT trends in autumn (SON, Fig. 6e) showed a significant correlation (R2 = 0.89) with the strongest warming and sea ice decline occurring for the FJL stations. In winter (DJF, Fig. 6f), a significant correlation was found as well, however, there was a clear regional difference between stations located in Svalbard south-west-north and stations in Svalbard east and FJL. The two latter areas, located in the east, had much lower SIC-trends during winter, than for the Svalbard south-west-north stations despite the as-high SAT trends of similar magnitude (Tables 1, 3). The outcome is shown as two separate regression lines in Fig. 6f for the south-west-north group of stations (R2 = 0.95) and the eastern stations (R2 = 0.70), respectively. On a seasonal scale, the SST peaks in August, in close correspondence with the timing of SIC minimum (August–September), see Fig. 5. On the other hand, the SST trend has a remarkable strong peak in July (mainly NBS and FJL) prior to the SST peak, and a second peak in October–November (the third period in NBS and FJL and for all three periods in the Svalbard region) just before the trough of the SIC trend (Fig. 5). The two peaks in the SST trend caused a prolonging period of a warmer sea surface in the summertime. The warming trend in late autumn during 2001–2020 correlated well with the corresponding significant autumn peak seen in the SAT trend (Table 1). Discussion How do the SAT trends in northern and eastern Svalbard and FJL compare to those in western and southern Svalbard?Our study showed significant and pronounced warming for the entire Barents area. The annual warming rates accelerated from 1981 to 2020 to 1991–2020 at all stations with sufficiently long series. At the northern and eastern stations, the acceleration continued into the latest period (2001–2020), while the trends dropped more or less off at the stations in the south and the west. These differences in changing trends were mainly connected to conditions in autumn and winter. In winter, the trends during 2001–2020 dropped off after high values during 1991–2020 at all stations. The autumn trends, on the other hand, accelerated everywhere, though less so in the south and the west. While the increased autumn trends in the northern and eastern regions more than compensated for the decreased winter trends, this was not the case at the western and southern stations. A reason for the differences in autumn may be that sea ice has been sparse in autumn in the west and the south during the entire period (Fig. 5a), thus the sea ice trend has been close to zero, while it has been negative elsewhere. The accelerated warming up to the latest decade is in agreement with the most recent assessments of instrumental observations in the Arctic7,8. Przybylak and Wyszyński8analyzed trends from 1951 to 2015 and showed that the strongest temperature increase in the Arctic in winter was observed over Svalbard, but no stations in north-eastern areas were then available. By including newly available SAT observations from northern and eastern Svalbard and from FJL, we were able to additionally study the regional SAT developments in the NBS. Our main findings are summarised in Fig. 7 and show that the warming in western Svalbard is large, but even larger in northern and eastern Svalbard and in FJL. From 1981 to 2020, we found an annual warming rate varying between 1.0 and 1.6 °C per decade, whereas, over the two periods 1991–2020 and 2001–2020, the annual warming rates ranged from 1.1 to 2.7 °C per decade. These rates are stronger than hitherto known in this region. The increasing temperature rates for the Northern Barents Sea region are exceptional on the Arctic and global scale and correspond to 2 to 2.5 times the Arctic warming averages and 5 to 7 times the global warming averages (Fig. 7). Figure 7 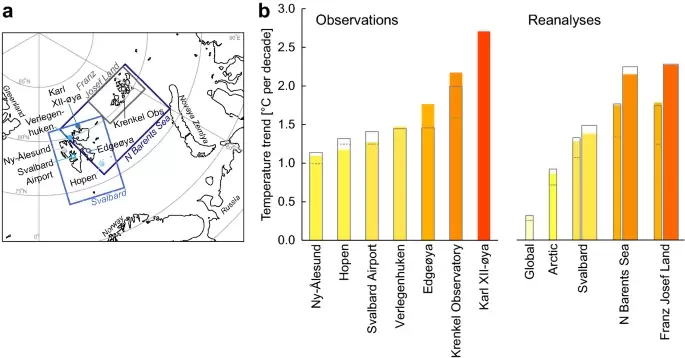 Temperature trends based on instrumental observations and ERA5 and CARRA reanalyses. (a) The location of the main stations and main regions in the study. (b) Linear trends for annual SAT series and reanalyses for the period 2001–2020. Bar colours follow the colour scale for SAT in Fig. 2. If available, the SAT trends over the 1981–2020 and 1991–2020 periods are additionally shown as dotted and solid grey line bars, respectively. On the right hand side of the bar plots, the ERA5 and CARRA reanalyses are shown as thin and thick bars, respectively. In addition, SAT trends for ERA5 for the Arctic (i.e. north of 65° latitude) and global mean are shown. The map in a was generated using Python version 3.6 (http://www.python.org) including pyresample 1.19. How well do reanalyses describe SAT-climatology and SAT trends in the Barents study area, especially for sites and periods without SAT observations available for assimilation?Our results suggest that both CARRA and ERA5 do a reasonable job in reproducing the observed SAT-climatology and -trends in the high Arctic. However, CARRA seems to represent the SAT more accurately than ERA5, which is in general agreement with Køltzow et al.39. However, Køltzow et al.39 only verified CARRA and ERA5 with observations that also were available during the production of CARRA. Our results support their findings and indicate that it is also valid for both periods with and without SAT observations available for the production of the reanalyses, and independent of sea ice conditions. The improved representation of SAT in CARRA originates from a combination of finer resolution, a better description of cold surfaces, and the use of more local observations37. In CARRA the biases did not change between periods with and without available local SAT observations for assimilation, i.e. we did not find evidence indicating that observations used periodically had a large impact on trends in CARRA for the few investigated locations here. However, it should be noted that the SDE is reduced in the periods with assimilated SAT observations. For ERA5, a limited amount of SAT observations are assimilated, but these observations seem important as the affected locations are among the sites with the highest correlation between observations and ERA5. For some locations (e.g. Karl XII-øya), the biases are clearly affected when sea ice is present. This is in agreement with other studies showing discrepancies in ERA5 for low SAT and high SIC values26,29. Therefore, it seems that changing sea ice conditions alter the bias by adding an “artificial trend contribution”. This may in turn result in reduced temperature trends in the reanalysis, due to a pronounced warm bias under close ice conditions. This situation is more complex along the coast and fjords of Svalbard, as in addition to the treatment of sea ice and the stable boundary layer, the representation of the coastline (ocean/land contrast) contribute to biases in the reanalysis. Hence, the biases show substantial spatial variability and are difficult to generalize. As CARRA has overall smaller biases than ERA5 (Fig. 6b, Table S3), it may explain why the trends are both stronger in CARRA than in ERA5 (Figs. 2 and 4) and apparently more correct. How much of the SAT variability is coupled with the SIC and SST variations?Our results showed that SST increased by up to 0.8 °C per decade in the latest two decades along the western and southern Svalbard, as well as in the southeastern Barents Sea. This is among the highest sea surface warming rates observed in the Northern Hemisphere, and eight times the global mean area-weighted trend in SST40. The increase in SST is most likely associated with the larger and warmer Atlantic Water inflow to the study region12,17,18,20,41and the prolonged summer season with high SST in late-autumn may be a crucial preconditioning for the delayed freeze-up that was observed for the NBS and FJL in this study (cf. Timmermans & Labe42). We demonstrated that the SAT increase is strongly linked, both in space and time, to the large reduction of sea ice in the NBS, especially during autumn and winter. This corresponds well with the earlier findings10,12, who pointed out that the loss of sea ice, and thereby the loss of the local freshwater contribution, may destabilize the water column and bring up more heat to the surface from the layer of Atlantic Water. This destabilization results in large heat flux from the ocean to the atmosphere due to a relatively warm ocean in winter. The high correlation between SAT- and SIC-trends in autumn and winter indicated both a local and regional influence that varies among the two respective seasons (Fig. 6e,f). The high correlations seen in autumn suggest a strong local influence of SAT directly related to the SIC trend near the stations, while the regional dependency seen in winter appears to be controlled by the location of stations and the distance to the sea ice edge. The stations located in Svalbard south, west, and north all have low absolute SIC levels (1991–2020 SIC winter mean of 24–53%) and thus are more directly affected locally by open ice and open sea nearby their location. We found that the most extreme changes in both SAT and SIC occurred over northern Svalbard at Karl XII-øya, with a winter warming rate of 5.1 °C per decade and a SIC-decline of -24.7% per decade, over the period 1991–2020 (Fig. 6f, Table 3). Sea ice cover variability together with water mass dynamics (e.g. colder surface water masses in summer than in winter, cf. Renner et al.43) may explain why Karl XII-øya shows different temperature trends and temperature variability compared to the other stations. Compared with Verlegenhuken, Karl XII-øya is a small island located 180 km further northeast and the area between Verlegenhuken and Karl XII-øya is strongly affected by sharp temperature gradients and trends (Fig. 2c) across the marginal ice zone, especially in winter. In addition, the strongest SST increase was observed in winter for Svalbard west, upstream the West Spitsbergen Current (with respect to the location of Karl XII-øya). The extreme changes found on Karl XII-øya correspond well with the increased heat transport of Atlantic Water by the West Spitsbergen Current, that has a major impact on the reduction of sea ice north of Svalbard in winter12,18,43; the excess of heat transport is providing enough energy to keep the area ice-free for longer periods in winter44, which in turn has expanded the ice-free region further east in recent years12,18,45. This has led to a large oceanic heat loss to the atmosphere in the entire area (cf. Onarheim et al.18; Renner et al.43; Skagseth et al.20) strongly supported by the recently high winter temperature on the Karl XII-øya. The stations on eastern Svalbard and FJL are dominated by cold Arctic air and cold and fresh surface water, with low SAT (Fig. 3a,b) and high SIC (winter mean SIC more than 76% for 1991–2020). Although the regional SIC-decline for NBS in winter is large (Table 3), the local sea ice conditions near the eastern stations are represented by high SIC and significantly low SIC trends in winter with a lower correlation with SAT than the western stations (Fig. 6f). The large local SAT increase at these stations, therefore, suggests a different warming mechanism than seen for the other stations. One possible explanation is that the high warming trends seen for Svalbard east and FJL stations can be attributed to changes in winter air mass characteristics associated with air advection from areas with lower-than-normal ice concentration and a larger ratio of open water, near the ice edge in the Barents Sea (Fig. S7). This is supported by earlier findings33 based on analyses of air mass characteristics performed on large-scale atmospheric circulation types over western Svalbard. One of their main findings was that due to the winter sea ice decline in the NBS, this region apparently has acted as a major remote heat source area for the recent warming in western Svalbard, with cyclonic air advection from east and northeast (Ec and NEc, respectively) being responsible for a major part of the warming. Following the earlier analysis on cumulative air temperature anomalies within various atmospheric circulation (AC) patterns33, we updated their results by including SAT from the Krenkel Observatory (Fig. S8). We found strikingly similar results for the Krenkel Observatory as for the western Svalbard stations, with the largest warming anomalies accounted for by the Ec and NEc circulation types. Since FJL is located further east, an Ec wind pattern over Svalbard west may result in air advection more from the southeast over FJL, depending on the exact location and size of the low-pressure system. This may suggest that the recently observed strong wintertime atmospheric warming in FJL has been driven by an increased heat exchange due to the diminishing sea ice cover east-southeast of FJL, towards Novaya Zemlya and the Kara Sea. This area is the most extreme hot spot area found in the SAT- and SIC trend maps (Fig. 2), corresponding to the area with the largest modeled heat loss in the Barents Sea20 and an extreme winter warming during 2000–201646. Our results (Fig. 6) document a stronger SIC-SAT relation during the 40-year period 1981–2020 than previously known12,33,35,47 for the NBS and contribute to additional knowledge on how the presence of sea ice affects the local and regional SAT. Although it remains unclear whether and to what degree the SAT increase is driving the SIC decrease35, or vice-versa12we highlight that the recent warming was punctuated by an increasing intensity of abrupt warming events (Fig. 6c,d), with peaks in 2006, 2012 and 2016. These findings are consistent with research showing that the general warming trend of the Atlantic Water upstream of the Barents study area was disrupted by pulse-like events of abrupt warming and cooling, linked to variability in Atlantic water inflow10,12,20. The strong SIC-SAT relation suggests that these SAT extremes both contributed to and in part were caused by extremes in the SIC record (cf. Thoman et al.1), with far-reaching effects. For instance, the extreme SAT periods strongly affected the terrestrial environment on Svalbard34,48,49,50. Finally, an accelerated warming in both the sea surface and surface air temperature together with withdrawing sea ice causes feedbacks in the Arctic climate system47,51 with faster and larger increases in precipitation52and where rain is projected to become the dominant form of precipitation towards the end of the twenty-first century53. Summary and conclusions This study has established an extended and consistent high-quality dataset on instrumental surface air temperature (SAT) observed over the period 1981–2020 from the Arctic warming hotspot archipelagos Svalbard and Franz Josef Land in the northern Barents area. We examined the recent warming and its associated variability over the northern Barents area. Further, SAT series from on-site instrumental measurements were compared with the SAT data from the most recent ECMWF reanalysis data set (ERA5) and the recently released regional high-resolution Copernicus Arctic Regional ReAnalysis (CARRA). Furthermore, we related the trend in SAT pattern to variations in Sea Ice Concentration (SIC) and Sea Surface Temperature (SST) based on data from global data sets (EUMETSAT OSI SAF and ESA SST_cci, respectively) and high-resolution ice charts (MET Norway). We found an unprecedented increase in annual SAT of up to 2.7 °C per decade at Karl XII-øya. The highest warming rates were found in the northern and eastern parts of the Barents area and were up to twice as high than hitherto known in this region from reference station series in the western and southern part. Our results additionally demonstrated that while CARRA and ERA5 reproduced the gross features of the observed trends, CARRA shows more spatial details and larger regional SAT trends. The regional warming rate for the Northern Barents Sea region is exceptional and corresponds to 2 to 2.5 times the Arctic warming averages and 5 to 7 times the global warming averages. Finally, we showed that the warming has been strongly linked, both in space and time, to the large reduction of sea ice and increased SST. Our results also documented a stronger SIC-SAT relation than previously known for the northern Barents Sea with both local and regional relations that varies among seasons. Methods We have focused on three periods, covering 40, 30 and 20 years beginning from 1981, 1991, and 2001, respectively, and all ending in 2020. Starting in 1981, the available records in the first period encompass the pronounced Arctic warming beginning after the 1990s8,54, also known as the modern period of Arctic amplification55. The 40-year period (1981–2020) covers the modern satellite era including a set of global reanalyses and satellite-retrieved data on sea ice concentration (SIC) and Sea Surface Temperature (SST), whereas, the 30-year period (1991–2020) covers the latest standard reference baseline period from the World Meteorological Organization (WMO) and the Arctic Regional reanalysis CARRA, in addition to two new SAT station series from eastern and northern Svalbard (Edgeøya and Verlegenhuken, see below). The 20-year period (2001–2020) includes the new SAT station series at Karl XII-øya. This is the northernmost (80°39′N) SAT series spanning the most recent period in the Barents region. All three SAT series have been significantly extended in this study (see below). Especially the early part of the three new series was not available during the production of the reanalyses. Moreover, the two latter periods partly covered the years prior to the regime shift on the Arctic SAT time series, with rapid change in mean annual SATs detected in 1995 and 20057,8. Instrumental surface air temperature (SAT) dataRussian regular instrumental observations on FJL started in 1929. In this study, four stations were used (Fig. 2a and Table S1). Three of them were closed in the 1990s (Rudolf Island, Ostrov Victoria and Nagurskaya). Only one station (Krenkel Observatory), located in the central part of the archipelago, had been in operation during the whole study period, except for the period 2001–2004. A long-term composite series for Krenkel Observatory has also recently been established38 (Fig. 3a). On the northern and eastern islands of Svalbard, automatic weather stations (AWS) have been in operation since 1991 (Fig. 2a and Table S1). However, during the early years, the data were not stored in MET Norway’s database and there was no quality control at that time. In this work, we have made older data from the 1990s and 2000s available for three stations (Edgeøya, Verlegenhuken and Karl XII-øya) and performed data quality control on three other stations from the 2010s (Kvitøya, Kongsøya and Sørkappøya). The data control was challenging for the oldest part of the data, 1991–2010, in particular before the year 2005, because of the large number and the varying kinds of errors (see Supplementary Information). The most important methods were limit controls and so-called dip tests. These methods were used stepwise. An additional difficulty was that some observations had slightly wrong time stamps. The AWS, all in remote areas, are not easily accessible for repair and were often destroyed by polar bears. This resulted in a large number of gaps in the series until a new station setup was developed by the Norwegian Meteorological Institute in 2010 (for details see Supplementary Information). The missing values were interpolated through linear regression analysis by neighbouring stations and for Verlegenhuken and Karl XII-øya also ice concentration was used (Supplementary Information). The homogeneity of the series was checked by the recommended homogenization method HOMER56. However, the many gaps in the series hampered its use (Supplementary Information). Suspicious values in the final series were extensively discussed and checked (e.g. very low temperatures at Karl XII-øya in November, December, January 2010/2011, and low variability in daily temperatures during summer 2001 and summer 2010–2011). All were found to be reliable. The significance of temperature trends was studied by the non-parametric Mann–Kendall test, which is a rank test31,57. The new data series from Edgeøya, Verlegenhuken and Karl XII-øya were compared with the long-term, daily SAT series from western Svalbard (Svalbard Airport and Ny-Ålesund) and south-eastern Svalbard (Hopen) (Fig. 3b-c). These series were used as a reference and were earlier scrutinized and homogenized by Førland et al.22 and Gjelten et al.32. For Svalbard Airport a long-term composite series from 1898 exists24,31 (Fig. 3a). All Russian and Norwegian stations are situated close to the sea (see Fig. 2a) at elevations between 5 and 28 m a.s.l. Thus, all stations are influenced by the ocean and sea-ice conditions year-round. Svalbard Airport and Ny-Ålesund are the most “continental” stations, lying in the fjords Isfjorden and Kongsfjorden, respectively. According to Starkweather et al.58, there have been improvements in the quality of Arctic air temperature forecasts and reanalyses since 2005, particularly downstream of automatic weather station (AWS) sites. The series from the AWS stations on the Svalbard north and east used in this study have been upgraded in recent years and are being continued. These data, together with the other Svalbard stations and the Krenkel Observatory on Franz Josef Land, will be important in documenting climate changes as well as central in evaluating and further developing weather models, reanalyses and climate models in this hot-spot area of the Arctic. Reanalyses We used a set of global reanalyses, that have already been widely employed for the Arctic, to evaluate the spatial pattern of Arctic warming (Fig. 1), i.e. NCEP-reanalyses59 (the National Centers for Environmental Prediction (NCEP) and the National Center for Atmospheric Research (NCAR), NOAA/ESRL Physical Sciences Division), MERRA-260 (NASA’s Global Modeling and Assimilation Office (GMAO)), JRA5561 (the Japan Meteorological Agency (JMA)) and ERA59 (the C3S/European Centre for Medium-Range Weather Forecasts (ECMWF)). No remapping into the same horizontal grid resolution was performed, i.e. the results were mapped onto different grid resolutions. In further analyses, we used ERA59 and the recently released high-resolution C3S Arctic Regional ReAnalysis (CARRA37). The ERA5 dataset covers the whole period 1981–2020, and compared to other global reanalyses ERA5 performs well in the Arctic, with the largest improvements in the wind and temperature fields28. CARRA covers the period 1991–2020. ERA5 provides lateral boundary conditions to the CARRA reanalyses. In our study, CARRA and ERA5 were compared with daily mean SAT observations at three locations for recent periods (mainly after 2010, observations were used in CARRA, but not in ERA5 due to land-fraction below 50%), and for earlier periods (mainly before 2010, observations not available in either CARRA or ERA5) in northern and eastern Svalbard. Further, the representation of SAT over sea ice has earlier been shown to be a weakness in many reanalyses26,27,29,30. Therefore, we additionally investigated how the presence of nearby sea ice impacted differences in SAT between observations and the two reanalyses at ten observation sites (Table S3). Both the availability of observations for assimilation in given periods and the presence of sea ice may give periodically changed biases, which ultimately may have had an impact on the SAT trends in the reanalyses. For most of the periods with missing observations, the differences between CARRA and ERA5 and the interpolated observations were similar to the differences when compared to on-site observations. However, at a few locations and seasons, and in particular at Edgeøya during NDJFMA (mainly January and February 1998), the deviations from the observations in CARRA, and partly ERA5 were different and larger than in other periods. This suggests that there are issues with either the reanalyses or the interpolated observations for this period that need further investigations. Sea ice concentration (SIC) and sea surface temperature (SST)For sea ice concentration (SIC) and sea surface temperature (SST) we used satellite-retrieved data. The global sea ice concentration climate data record, v2.0, consists of daily SIC data from 1979 to the present day and is produced by the EUMETSAT Ocean and Sea Ice Satellite Application Facility (OSI SAF, https://osi-saf.eumetsat.int/). The SIC is based on passive microwave radiometers data and is provided on a 25 × 25 km spatial grid62. In order to study the mean ice conditions and trends, monthly and annual averages are computed from the daily values and linear trends calculated over the period of interest (Figs. 1e, 2g–i, 5, 6b–d, Table 3, S7). Regional sea ice time series were computed by averaging the daily SIC over the three predefined main regions (Svalbard, NBS and FJL) and four sub-regions around Svalbard (SvalN, SvalE, SvalS, SvalW, Fig. 2a, Table 3). Decadal trends were generated from these mean SIC time series for the three periods of interest. Due to the low resolution, these data cannot be used in detailed studies within fjords or close to the coastline. Information from high-resolution navigational ice charts has been used to study the ice conditions closest to the individual SAT land stations and was used to calculate SIC changes and trends (Fig. 6a, Table 3). Ice charts have been routinely produced by the Norwegian Ice Service at MET Norway (NIS, https://cryo.met.no/en/ice-service) since the winter of 1969/70. In the beginning, the charts were based on analogue infrared satellite images, but since the summer of 2007 increasing volumes of high resolution synthetic aperture radar (SAR) satellite data have become available. More details can be found in Hughes and Wagner63. The NIS-dataset has been used to calculate daily SIC at a local scale around all the weather stations for the period 1981–2020 (Fig. 5a,c,e,f, Table 3). Time series were produced based on 50 km × 50 km and 100 km × 100 km boxes centered around the stations. Land areas were masked out and only data with zero land fraction in the gridded ice charts were used. Our analyses showed only minor differences between the mean SIC-series obtained from the 2500 and 10,000 km2 boxes. To evaluate the spatial pattern of the SST trends (Figs. 1f, 2j–l, Table 3) we used a gap-free climate data record of global sea surface temperatures that represents a multi-satellite estimate of daily mean SST at 20 cm depth with a feature resolution of about 20 km (0.05 degree on a regular latitude–longitude grid) derived from satellite infrared observations64. The dataset has been produced as part of the European Space Agency (ESA) Climate Change Initiative Sea Surface Temperature project (ESA SST_cci, v2.1) and covers the period 1981–2016. The remaining years, 2017–2020, are taken from the interim climate data record v2.0 extension which is generated under Copernicus Climate Change Service (C3S) and is available from the C3S climate data store. Temporal and spatial averages are computed from SST in a similar manner as for the OSI SAF SIC. Note, that in these average calculations, SST values below sea ice—fixed at − 1.8 °C—are included. Data availabilityThe datasets generated and/or analysed during the current study are available in the following repositories: Surface Air Temperature (SAT) from weather stationsAll SAT data based on observations from norwegian weather stations can be downloaded from MET Norway's archive of historical weather and climate data: https://seklima.met.no/and https://frost.met.no. Surface Air Temperature observations from the Russian weather stations can be downloaded from the Russian Scientific Research Hydrometeorological Institute (www.meteo.ru), AARI archives of historical weather and climate data (www.aari.ru) and Russian patent archive (https://www1.fips.ru/publication-web/publications). Surface Air Temperature (SAT) from ReanalysesThe 2 m air temperature derived from reanalyses data such as ERAINT, ERA5, NCEP, and CARRA data can be downloaded from the COPERNICUS climate data store at https://cds.climate.copernicus.eu The Japanese 55-year Reanalysis (JRA-55) can be downloaded from the research data archive—Computational and information system lab at https://rda.ucar.edu/datasets/ds628.0/. The Modern-Era Retrospective analysis for Research and Applications, Version 2 (MERRA2) can be downloaded from the Goddard Earth Sciences data and information Service center at https://disc.gsfc.nasa.gov/datasets?project=MERRA-2. Sea Ice Concentration (SIC)EUMETSAT Ocean and Sea Ice Satellite Application Facility, global sea ice concentration climate data record 1979–2015 (v2.0, 2017), OSI-450, https://doi.org/10.15770/EUM_SAF_OSI_0008. Data can be extracted from the OSI SAF FTP server ftp://osisaf.met.no/reprocessed/ice/conc/v2p0. EUMETSAT Ocean and Sea Ice Satellite Application Facility, Global sea ice concentration interim climate data record 2016-onwards (v2.0, 2017), OSI-430-b. Data can be extracted from the OSI SAF FTP server ftp://osisaf.met.no/reprocessed/ice/conc-cont-reproc/v2p0/. High-resolution navigational ice charts produced by the Norwegian Ice Service at MET Norway (NIS) can be downloaded at https://cryo.met.no/en/ice-service. Sea Surface Temperature (SST)The dataset citation for the CCI L4 CDR v2.1 is: Good, S.A.; Embury, O.; Bulgin, C.E.; Mittaz, J. (2019): ESA Sea Surface Temperature Climate Change Initiative (SST_cci): Level 4 Analysis Climate Data Record, version 2.1. Centre for Environmental Data Analysis, 22 August 2019. Doi: https://doi.org/10.5285/62c0f97b1eac4e0197a674870afe1ee6. https://doi.org/10.5285/62c0f97b1eac4e0197a674870afe1ee6. The SST CDR v2.1 is here supplemented by the interim CDR (ICDR) v2.0 extension which is generated under Copernicus Climate Change Service (C3S) and data is extracted from the C3S climate data store https://cds.climate.copernicus.eu/cdsapp#!/dataset/satellite-sea-surface-temperature?tab=overview. Code availabilityInformation about the codes can be obtained from the corresponding author upon request. References
"2012 WAS THE LAST - BIG EL NINO!" . . "2022 MAY BE . . THE LAST BIG . . LA NINA!" . . BEFORE . . "THE NEXT BIG EL NINO!" WHICH CAUSES . . "COMPLETELY ICE FREE ARCTIC!" . . 2022 HAD THE 2ND HIGHEST . . "GREENLAND SURFACE MELT EXTENT!" . . . . EVEN THOUGH IT WAS ONE OF . . "THE LARGEST TRIPLE DIP" . . "LA NINAS!" . . COLDER! THE NEXT . . "EL NINO" . . AND AS SAM HAS ARGUED . . COUPLED WITH . . "SUN SPOTS!" . . INSURE THE . . "CATACLYSMIC ALINGMENT!" . . "EL NINO" . . AND . . "SUN SPOTS!" . . INSURING . . A RAPID PATH TO . . "COMPLETELY . . ICE FREE . . ARCTIC!" . . "BLUE OCEAN ARCTIC" . . IS BUT A . . MILD EXAMPLE OF WHAT . . COMPLETELY ICE FREE! . . WILL CAUSE! . . AS UNTIL . . "ALMOST ALL OF THE ICE IS MELTED!" . . MOST OF . . . . "THE ARCTIC OCEAN WATER" . . REMAINS AT . . 5 C! . . THIS IS THE TEMPERATURE . . . . UNDER . . "THE DOOMSDAY GLACIER" . . "THWAITES GLACIER!" . . IN ANTARCTICA! . . THIS WAS THE TEMPERATURE OF . . "THE LAPTEV SEA!" . . LAST OCT 2021! . . . . THE FIRST TIME IT HAS BEEN . . "ICE FREE" . . IN OCTOBER IN A VERY LONG TIME! ONCE . . "THE ARCTIC IS . . COMPLETELY ICE FREE!" INSTEAD OF . . THE ICE ABSORBING . . . . THE ENORMOUS ENERGY OF THE SUMMER SUN IN THE ARCTIC! CAUSING IT TO MELT! PLEASE SEE THE PRIOR POST: "CHRIST'S MOST PROFOUND PROPHECY!" WHEN "THE ARCTIC IS ICE FREE!" "STRONG EL NINO COLLAPSE OF THE AMOC & THE 2ND COMING!" "BECOME ONE II!" TRANS HELL! PASSIONATELY LOVE GOD! NOT MONEY! "LOVE OTHERS WITH GOD'S LOVE!" GIVE YOUR WEALTH & LIFE TO GOD! VERY RAPIDLY! . . THE WATER TEMPERATURE WILL BEGIN TO RISE . . EXPONENTIALLY! . . RELEASING . . GIGATONS OF METHANE HYDRATES! . . THERE ARE 2 MILLION K2! ON . . "THE EAST SIBERIAN ARCTIC SHELF! ESAS!" . . OF 5 M K2 OF THE ARCTIC OCEAN! . . THE MASSIVE DEPOSITS OF METHANE HYDRATES ARE IN . . THE BARENTS SEA! . . THE YAMAL PENINSULA AND KARA SEAS! . . ALL THE WAY OVER TO THE ESAS! WHEN THE ARCTIC GOES . . "COMPLETELY ICE FREE!" . . "WATER TEMPS WILL EXPLODE!" . . MELTING GIGATONS OF THESE SURFACE METHANE HYDRATES! . . . . EXPLODING THE TOPS OFF MANY . . "DEEP METHANE DEPOSITS!" . . METHANE PINGOS! . . MAKING . . "SMALL METHANE SEEPS" . . INTO . . "TOWERING METHANE FOUNTAINS!" LITERALLY CAUSING . . "THE IMPLOSION OF LARGE PARTS OF THE BARENTS SEA" OVER . . TO . . "THE EAST SIBERIAN ARCTIC SHELF" (ESAS)! . . LIKE . . "HELLS GATE!" IN SIBERIA! PLEASE SEE THE PRIOR POSTS: THE LARGEST METHANE SEEP BELCHING 10 TONS OF METHANE PER DAY! THESE MASSIVE SEEPS WILL EXPLODE FROM BARENTS SEA TO THE EAST SIBERIAN ARCTIC SHELF! ALL OVER THE ARCTIC! WHEN THE ARCTIC IS ICE FREE! BY 2025-7! MELTING ANTARCTICA AND BURNING UP PLANET! STARVATION DUE TO CROPS BURNING UP & FLOODING! THE 3RD GLOBAL GENOCIDE KILLER! A BRUTAL WAY TO GO! WET BULB TEMPS, NO FRESH WATER OR FOOD! THE BIG THREE KILLERS! MONOPOLIST NAZI SLAVE OWNER'S DARK MONEY'S $1.6 BILLION SUPREME INJUSTICE POLITICAL BUYOFF! THE BAD NEWS ABOUT THE LACK OF DECLINE IN ARCTIC SEA ICE AND THE HORRIFIC NEWS ABOUT TOO MUCH BAD & TOO LITTLE CLEAN WATER! SECOND GLOBAL KILLER OF CROPS & PEOPLE! ABRUPT CLIMATE CHANGE LOCATIONS TO LIVE NEAR CLEAN FRESH WATER LOW RISKS TOP PICKS! 2025-7 "THE FIREY WAVES OF DEATH!" "WET BULB" TEMPS DRIVEN BY "HOT STUFF" INSURES 3-4 BILLION DEATHS 2 YEARS FROM "ICE FREE ARCTIC!" THE POOR DIE QUICKLY! THE REST EXIT PEACEFULLY OR NOT! RICH & WHORES FRY IN HELL! SATAN'S ANTI-CHRISTIANS! EVIL NOT GOD! "THE APOCALYPSE!" BY 2025-27! DUE TO "ICE FREE ARCTIC!" UNLEASHING "HOT STUFF!" "THE SIBERIAN METHANE MONSTER!" CHRIST'S MOST PROFOUND PROPHECY COMES TRUE! ONE DAY NORMAL! THE NEXT DAY! HELL ON EARTH! BY 2025-27! THE SECOND COMING! THE FINAL JUDGEMENT! 
THURSDAY, SEPTEMBER 8, 2022, SAM CARANA, ARCTIC-NEWS.BLOGSPOT.COM Blue Ocean Event 2022? The image on the right shows a NASA Worldview satellite image of a blue Beaufort Sea (with Barrow, Alaska, at the top left, on September 7, 2022). The image shows that there is a lot of open water between the coast of Alaska and the sea ice. To determine where there is open water and where the sea ice starts can be hard; the sea ice is often covered by clouds; furthermore, even when there are no clouds, the question remains what is to be regarded as sea ice. According to many, a Blue Ocean Event starts once Arctic sea ice extent falls below 1 million km². Arctic sea ice extent was 4.912 million km² on September 6, 2022, which is larger than the extent in many previous years around this time of year (see NSIDC image below). However, the sea ice has become very thin, resulting in many areas where only small pieces of ice are present.  NSIDC regard a cell to have sea ice if it has at least 15% sea ice, but when regarding a cell to have sea ice if it has at least 50% ice and if that's the case for ⅕ of the cells where there is (some) ice, then we're already in a Blue Ocean Event right now. So let's have another look at how much of the above 4.912 million km² can be regarded as sea ice, by using the NSIDC map with sea ice concentration as a guide. The roughly-sketched outline drawn over the NASA map below indicates that there may only have been some 991 thousand km² of concentrated sea ice left on September 6, 2022 (inset shows NSIDC sea ice concentration for the day). 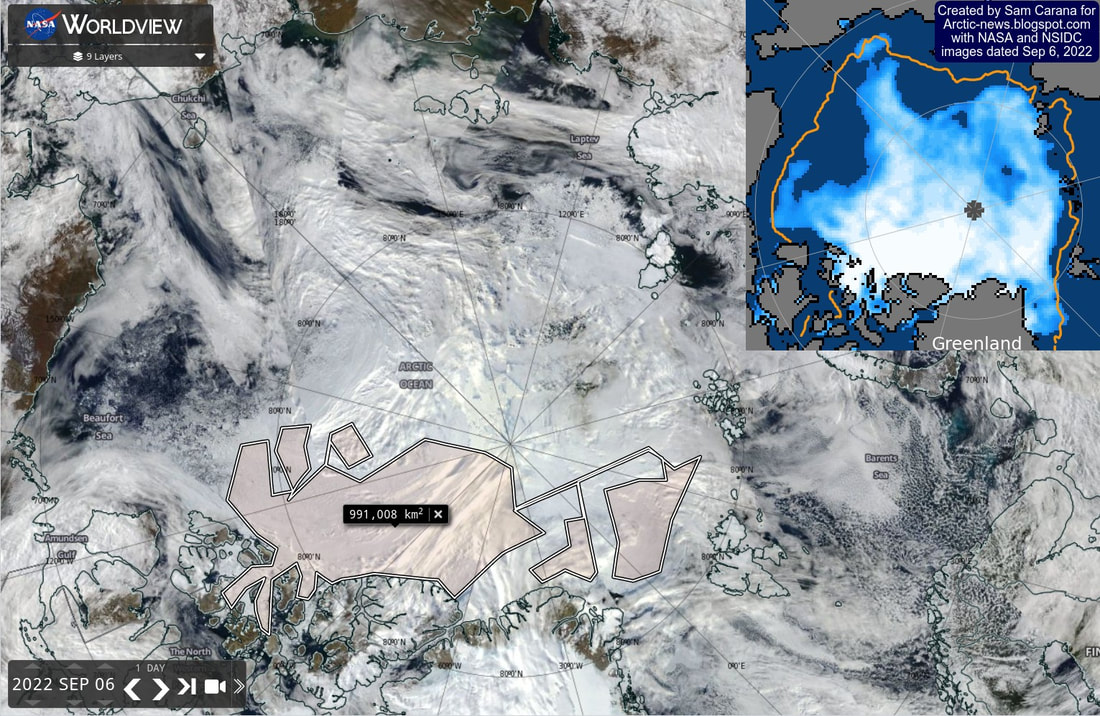 As said, it's a rough sketch, so some cells with a higher concentration of sea ice may have been left out. Having said that, we're currently in the depth of a persistent La Niña and the associated lower air temperatures contribute to a relatively larger sea ice extent than would otherwise be the case. In conclusion, depending on what is counted as sea ice, we could already be experiencing a Blue Ocean Event right now. Further events and developments A Blue Ocean Event constitutes the crossing of a huge tipping point and, as a strong El Niño looks set to emerge, this could trigger the unfolding of further events and developments leading to extinction of most species (including humans), as:
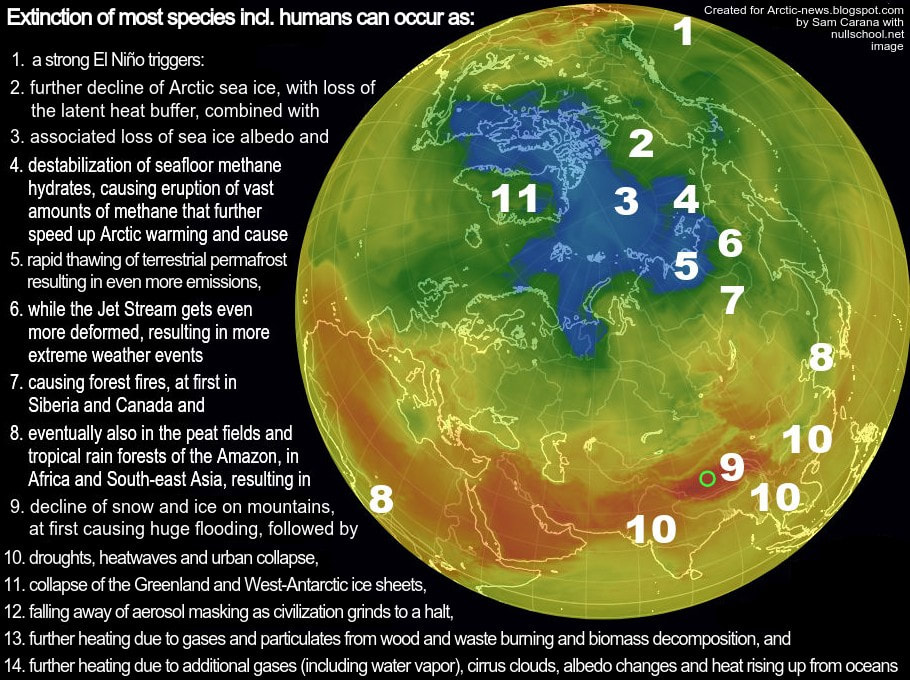 Importantly, depicted above is only one scenario out of many. Things may eventuate in different order and occur simultaneously, i.e. instead of one domino tipping over the next one sequentially, many events may occur simultaneously and reinforce each other. Further events and developments could be added to the list, such as ocean stratification and stronger storms that can push large amounts of warm salty water into the Arctic Ocean. 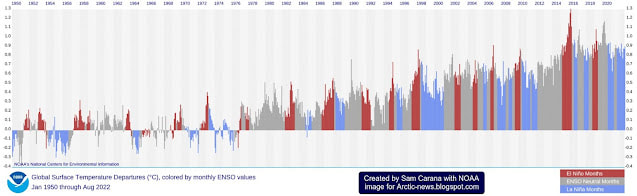 Here is another example of such a scenario. Recent studies indicate that human-caused climate change will soon increase El Niño frequency and intensity. Accordingly, the upcoming El Niño may well be strong. As illustrated with above image, we're currently in the depth of a persistent La Niña, which suppresses the temperature rise, whereas the opposite occurs during El Niño, which amplifies the temperature rise, and this especially affects the Arctic, which is already heating up much fasterthan the rest of the world. Also, the upcoming El Niño may very well coincide with a peak in sunspotsin 2025, further pushing up temperatures. The image below shows that the rise in sea surface temperatures on the Northern Hemisphere has been suppressed during the ongoing La Niña, but as we move into the next El Niño, the seafloor methane tipping point could be crossed even earlier than the current trend indicates, say by 2025. 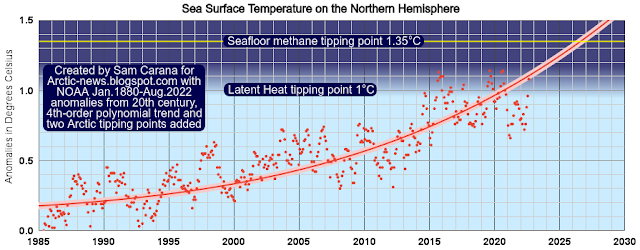 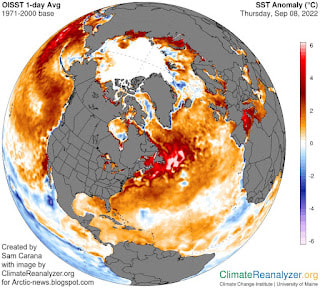 One reason for this is that the narrowing temperature difference between the Arctic and the Tropics will further deform the Jet Stream and in turn cause more extreme weather, leading to more loss of sea ice and thus of its capacity to reflect sunlight and act as a buffer against incoming ocean heat. A huge amount of heat has built up in the North Atlantic off the coast of North America, as illustrated by the image on the right. Furthermore, the temperature of the water may well be substantially higher some 50 meter below the sea surface than at the sea surface. As discussed in an earlier post, rising temperatures result in stronger winds along the path of the Gulf Stream that can make huge amounts of warm, salty water travel from the Atlantic Ocean toward the Arctic and reach shallow parts of the Arctic Ocean such as the East Siberian Arctic Shelf (ESAS), where most of the sea is less than 50 m deep. The danger is illustrated by the Argo floatcompilation below. 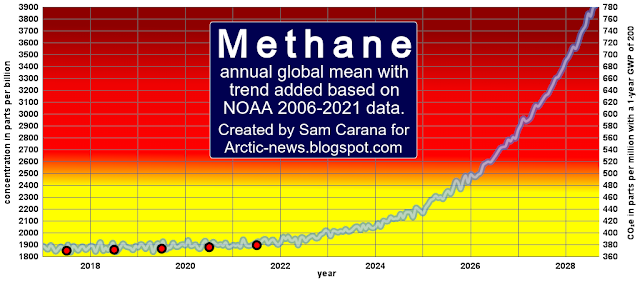 Very high methane levels The image below, from an earlier post, shows annual global mean methane with a trend added that points at a methane rise that could in 2028 represent a forcing of 780 ppm CO₂e (with a 1-year GWP of 200). In other words, the clouds tipping point at 1200 ppm CO₂e could be crossed in 2028 due to the forcing of methane and CO₂ alone, assuming that CO₂ concentration in 2028 will exceed 420 ppm. Moreover, this could happen even earlier, since there are further forcers, while further events and developments could additionally push up the temperature further, as discussed above. Furthermore, the NOAA dataused in the above image are for marine surface measurements. More methane tends to accumulate at higher altitudes, as illustrated by the compilation image below. 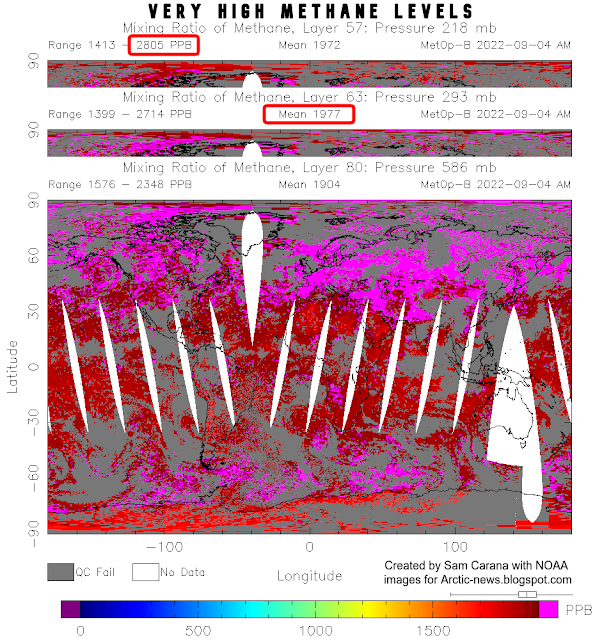 NOAA's globally averaged marine surface mean for April 2022 was 1909.9 ppb. The above image shows that, on September 4, 2022 am, the MetOp satellite recorded a mean methane concentration of 1904 ppb at 586 mb, which is close to sea level. At 293 mb, however, the MetOp satellite recorded a mean of 1977 ppb, while at 218 mb it recorded a peak of 2805 ppb. Such high methane levels could be caused by destabilization of methane hydrates at the seafloor of the Arctic Ocean, with large amounts of methane erupting (increasing 160 x in volume) and rising up at accelerating speed through the water column (since methane is lighter than water), concentrated in the form of plumes, which makes that less methane gets broken down in the water by microbes and in the air by hydroxyl, of which there is very little in the Arctic in the first place. Such a methane eruption entering the atmosphere in the form of a plume can be hard to detect as long as it still doesn't cover enough of the 12 km in diameter footprint to give a pixel the color associated with high methane levels. 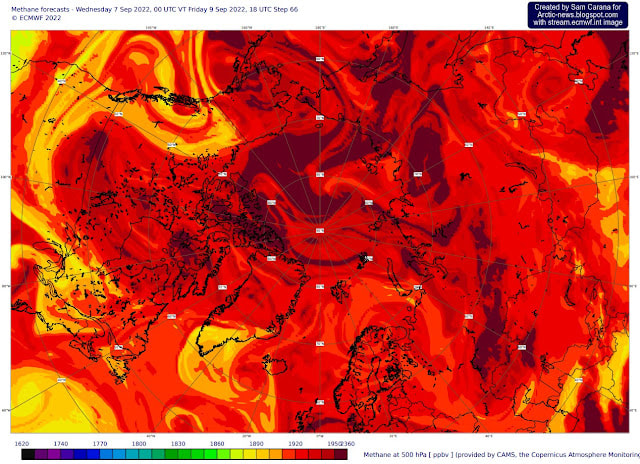 The above Copernicus image shows a forecast for September 9, 2022 18 UTC, of methane at 500 hPa. In the video below, from this page, Guy McPherson addresses the question: Has the “Methane Bomb” Been Triggered? Conclusion
The situation is dire and the right thing to do now is to help avoid or delay the worst from happening, through action as described in the Climate Plan. Links • NSIDC - Frequently asked questions https://nsidc.org/arcticseaicenews/faq • NASA Worldview https://worldview.earthdata.nasa.gov • NSIDC - sea ice concentration https://nsidc.org/arcticseaicenews • NSIDC - sea ice extent https://nsidc.org/arcticseaicenews/charctic-interactive-sea-ice-graph • More Frequent El Niño Events Predicted by 2040 Cutting-edge models predict that El Niño frequency will increase within 2 decades because of climate change, regardless of emissions mitigation efforts. https://eos.org/articles/more-frequent-el-nino-events-predicted-by-2040 • Emergence of climate change in the tropical Pacific - by Yun Ying et al. https://www.nature.com/articles/s41558-022-01301-z • Climate Reanalyzer https://climatereanalyzer.org/wx/DailySummary/#sstanom • Argo Float https://fleetmonitoring.euro-argo.eu/float • Monitoring of atmospheric composition using the thermal infrared IASI/MetOp sounder - by C. Clerbaux et al. https://acp.copernicus.org/articles/9/6041/2009 • NOAA - MetOp satellite methane data https://www.ospo.noaa.gov/Products/atmosphere/soundings/iasi • Copernicus methane forecasts https://atmosphere.copernicus.eu/charts/cams/methane-forecasts • Clouds feedback and tipping point https://arctic-news.blogspot.com/p/clouds-feedback.html • NOAA - global methane https://gml.noaa.gov/ccgg/trends_ch4 • NOAA - Sea surface temperature anomalies on the Northern Hemisphere https://www.ncei.noaa.gov/cag/global/time-series/nhem/ocean/all/8/1880-2022 • NOAA - Monthly Temperature Anomalies Versus El Niño https://www.ncei.noaa.gov/access/monitoring/monthly-report/global/202208/supplemental/page-4 • Albedo https://arctic-news.blogspot.com/p/albedo.html • Latent Heat https://arctic-news.blogspot.com/p/latent-heat.html • Jet Stream https://arctic-news.blogspot.com/p/jet-stream.html • Feedbacks https://arctic-news.blogspot.com/p/feedbacks.html • Blue Ocean Event https://arctic-news.blogspot.com/p/blue-ocean-event.html • Climate Plan https://arctic-news.blogspot.com/p/climateplan.html
0 Comments
Leave a Reply. |
"ONE LOVE"
"GOD'S LOVE!" PERMANENT . . CEASEFIRE! . . NOW! . .
TWO STATES! . . NOW! 
ISRAEL AND US WANT THE WATERFRONT OF GAZA AND THE OIL OFFSHORE OF GAZA!
VLAD WANTS UKRAINE'S GAS OIL PIPELINES FOOD PORTS AND DOESN'T WANT NATO ON ITS DOORS. CHENEY & BUSH . . THE EVIL RIGHT WING ROCKEFELLER TOLD US ON LAST 13 MIN OF ZEITGEIST DID 9/11, DOING GENOCIDE IN IRAQ & AFGHANISTAN TO TAKE OVER THE MIDDLE EAST THEN VENEZUELA WITH PLANS TO CHIP EVERYONE! KILLING THOSE THAT STOOD AGAINST THEM! GLOBAL GENOCIDE! "THANK GOD!" . . "IT IS . . THE END!" . . OF "RUTHLESS RULE" . . BY "THE EVIL RICH!" AMEN! UPDATED . . THE MOST IMPORTANT POST ON GOD'S SITE: "ENTER THE NARROW GATES!" TRUE NORDICS! THE GREEN PARTY! JILL STEIN BERNIE AOC THE SQAD! WIDE & BROAD ARE THE GATES TO HELL! TOTALITARIAN GANGSTER CAPITALISM & SOCIALISM! FORETOLD! "DONNY THE DEVIL!" OF SATAN'S EMPIRE! DAMN TRANS/GTLBX = GOD DAMNS U! SIBERIAN METHANE + HOT HOUSE EARTH + AMOC SHUTDOWN = "THE SIBERIAN MONSTER HURRICANE BERYL!" CAT 6! 150 F PLUS! SOON! "HOT STUFF!" "THE SIBERIAN METHANE MONSTER!" CAUSES THE METHANE HEAT WAVE AND SURFACE FIRESTORM! THE FIREY WAVES OF DEATH! BY 2027-30! CHRIST LAID OUT IN THE 1,500 TO 2,000 UNIQUE WORDS THAT THEY ESTIMATE HE SPOKE IN THE GOSPELS, THAT SUPPORTING . . "THE NORDIC MODEL" . . IS THE PATH TO ENTERING . . "THE NARROW GATES" . . INTO ETERNITY IN CHRIST'S / GOD'S HEAVEN. "THE FINAL TESTAMENT," WHICH I HAVE LAID OUT HERE. CHRIST TOLD ME TO JUST USE HIS WORDS HERE, TO SHOW THAT CHRIST . . "LOGICALLY" WAS THE FIRST . . RADICAL PACIFIST ANTI-WAR LIBERTARIAN DEMOCRATIC MARKET SOCIALIST . . THE FIRST NORDIC MODEL ECONOMIST! THE LOGIC OF THE GOD OF LOVE! NOTABLY A DANE. AS THE DANES HAVE PROVEN BY . . "THE FRUITS OF THEIR EFFORTS" . . THAT THEY HAVE CREATED THE MOST . . SUSTAINABLE HUMANE AND EGALITARIAN SOCIETY . . "AS IT IS IN HEAVEN! SO SHOULD IT BE ON EARTH!" . . THEY ARE MOST BLESSED NOW & IN HEAVEN! THE NORDICS, NOTABLY THE DANES, HAVE CREATED THE MOST BLESSED SOCIETIES/Y THAT . . "TAKES CARE OF THOSE IN NEED!" THE PRIMARY CRITERIA CHRIST SAID WILL DETERMINE IF YOU ARE BLESSED TO LIVE FOR ETERNITY IN HEAVEN, IN THE FINAL JUDGEMENT! NOT! THE RUTHLESS GREED FOR MONEY FOR THE SUPER RICH! BE BLESSED! SUPPORT . . THE NORDIC MODEL! . . BERNIE AOC THE SQUAD, THE TRUE PROGRESSIVES SUPPORTING . . "GOD'S MODEL!" . . "THE NORDIC MODEL!" 
The Purpose of Life Pray "Help Me To Love Others The Way YOU Love Me!" This IS ALL YOU NEED to Become One With God! I LOVE YOU SOO MUCH! "JC!" THE GOD OF LOVE!
JIM'S SUGGESTIONS: PRACTICE FOR HEAVEN! "LIVE LIKE THE PLANET IS DYING!" It Is THE END! LOVE MORE, AND LOVE MORE PEOPLE! TRY! FIND A CAUSE! GIFT AS MUCH AS YOU CAN! TO "THOSE IN NEED!" GIFT MOST OF YOUR WEALTH TO GOD! TO "THOSE IN NEED!" IF YOUR EVIL GREED HAS ENGULFED YOUR SOUL! IF YOU ARE VERY RICH! SUPPORT "AS IT IS IN HEAVEN, SO SHOULD IT BE ON EARTH!" SUSTAINABLE, HUMANE AND EGALITARIAN! "THE SHE NORDIC MODEL!" JILL STEIN BERNIE AOC & THE SQUAD! AND . . "BECOME ONE!" REALLY OPEN YOUR LIFE TO GOD'S LOVE! GOD WANTS TO BE YOUR BFF! LET GOD GUIDE AND FULFILL YOU! LOVE GOD WITH ALL OF YOUR PASSION! EVERY DAY! IF YOU DON'T BELIEVE IN GOD! BE A "GOOD HUMANIST!" AND . . "I WILL SEE YOU IN HEAVEN SOON!" JIM "JAZZIE" GOD'S TRANS GENDER DAUGHTER. CHANNEL FOR WRITING "THE FINAL TESTAMENT OF JESUS SARAYU MAMMA AND FATHER GOD!" "THE ONE!" TRANS MRS DENMARK! DANISH CHRISTIAN HUMANIST! FOCUSED ON "THOSE IN NEED!" IN MY DREAMS! VERY FEM! 
THE PRIMARY CHANGE FROM 2016 GENDER SOCIETY OVERVIEW BELOW. WHERE I FORECAST 2100 FOR "ICE FREE ARCTIC" WAS THE START OF MASSIVE METHANE RELEASE DOCUMENTED FROM 2016-2017.
IN 2017 DR. PETER WATAMS CAMBRIDGE FORECAST "ICE FREE ARCTIC" BY 2025! CHRIST SAID, THIS IS WHEN "MY MOST PROFOUND PROPHECY" WILL BE FULFILLED! AT THE END TIMES, IT WILL BE LIKE NOAH & SODOM & GOMORRA, ONE DAY NORMAL, NEXT HELL ON EARTH.

GOD’S . . JC’S . . PROGRESSIVE NEWS, SCIENCE & TRUE CHRISTIANITY! . .
. . “THE LIBERATION THEOLOGY OF JESUS CHRIST!” . . “JC!”. . . . “ALL TRUTH!” . . . . “NO LIES!” . . TO HELP PREPARE . . . . “YOUR SOUL!” AS . . . . “It Is THE END!” . . . . . . “SAVE YOUR SOUL!” . . . “BECOME ONE!” NOW! PLUS . . . . . . MORE PROGRESSIVE NEWS, INSIGHTS AND ANALYSIS . . IN 1 POST . .THAN CNN IN A YEAR! CHRIST STATED: I HAD TO COME TO TELL "YOU" "MY FATHER'S WILL!" WHICH MY FATHER HAS UPDATED TO TODAY! ON "GOD'S SITE!" SOON! "YOU" WILL BE JUDGED! BY HOW "YOU" "DO MY FATHER'S WILL!" "TAKE CARE OF THOSE IN NEED!" NOT "YOUR EVIL GREED!" OR "FRY BABY FRY!" IN THE IMPACTS OF "YOUR EVIL GREED!" . . VERY SOON! "The Spirit of the Lord is upon me; he has anointed me to tell the good news to the poor. He has sent me to announce release to the prisoners and recovery of sight to the blind, to set oppressed people free, and that the time of the Lord ’s favor has come.” Luke 4:18-19 Christ's Message is . . Good News for The Poor Imprisoned Blind and for The Oppressed! It is . . "The Last Warning" for . . THE EVIL RICH and The Oppressors! The EVIL Republicans Right Dems Right Independents and Right Anti-Christians! Support The Nordic Model Now! Gift Your Evil Income & Wealth! Or Fry in Hell You caused! "Depart From ME!" "Ye" "That Have Worked" . . "The Most Evil Iniquity of Wealth, Income & Justice! Of ALL TIME!" "To THE REST!" . . Do what Tori sings so amazingly in the first video. Pray "Help Me To Love Others The Way YOU LOVE ME!" Support "As it is IN HEAVEN!" Sustainable Humane and Egalitarian . . "The Nordic Model!" Bernie / AOC / The Squad! Now! Gift as much as you can! Little did I know over the past 20 plus years of going to Maui, our favorite spot, and laughing at the sign below, that "Christ" would select me to "prepare the way!" Truly "Jesus Is Coming Soon!" By 2025-2030! Soon after "The ARCTIC is Ice Free!" The Spiral below goes to Zero! Prepare your Souls! . . NOW! THESIS SUMMARIES & Key Links SideBar Below 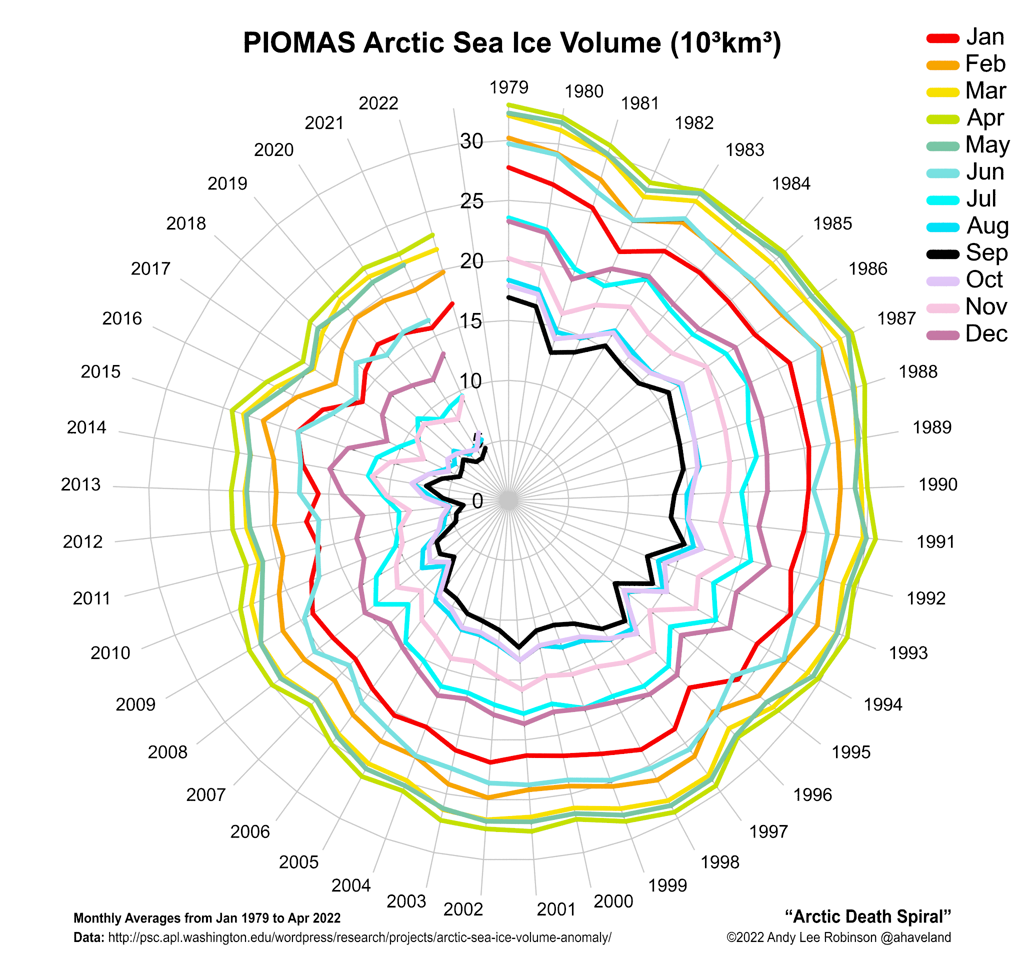


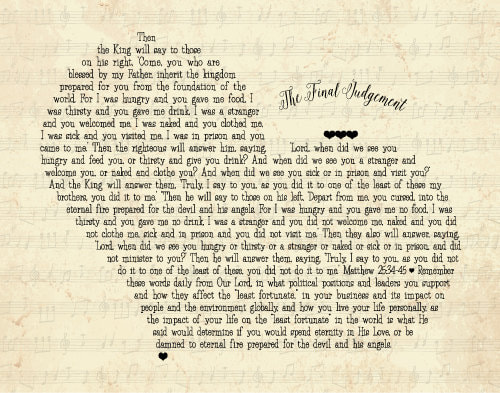
THE FINAL TESTAMENT OF JESUS CHRIST! “THE LOGICAL GOD OF LOVE!”
"MY HIS STORY" My journey with "JC!" My BFF! The Only Reason! "Become One!" NOW! In process but most is here or on my "Jazzie" page. "JAZZIE" . . "LITTLE Jc" My Trans story written in spring 2016. "His Site" was launched in 8/2015. Amazing how little has changed! Need to join Gender Society to read bios! The primary NEW INFO. Methane Release has skyrocketed! Which I have documented here! Hence, "It Is THE END" by 2030! Not by 2100! CLICK HERE FOR THE PDF FILE! . . OF . . "JAZZIE!" . . "LITTLE Jc!" VISIT GENDERSOCIETY! PROVING . . CHRIST'S MOST PROFOUND PROPHECY! . . BY 2022 TO 2027! PLEASE READ "CHRIST'S MOST PROFOUND PROPHECY!" WHEN "THE ARCTIC IS ICE FREE!" "STRONG EL NINO COLLAPSE OF THE AMOC & THE 2ND COMING!" "BECOME ONE II!" TRANS HELL! PASSIONATELY LOVE GOD! NOT MONEY! "LOVE OTHERS WITH GOD'S LOVE!" GIVE YOUR WEALTH & LIFE TO GOD! WELCOME TO "THE END OF THE WORLD!" "THANK GOD!" "It Is THE END!" PUTIN STARTS WWIII! 1 "THE FINAL JUDGEMENT" BY 2027! DURING "THE SECOND COMING!" MOST BLESSED - "NORDIC MODEL SUPPORTERS!" THE MOST DAMNED "THE EVIL RICH & RIGHT WING ANTI-CHRISTIANS!" JOE DO "THE SUMMIT TO SAVE OUR SPECIES!" AND "ONE LOVE!" NOW! PREPARE YOUR SOULS - NOW! BECOME "ONE" WITH "THE ONE!" NOW! THE END IS MUCH CLOSER THAN YOU THINK! WHEN I SPEAK - "AS MY FATHER" - I SPEAK - "FOR MY FATHER!" BECOME ONE! - NOW! HIS CHANNEL! LOVE U! MY PRIMARY ROLE IS AS MY CLOSEST SPIRITUAL BROTHER, JOHN THE BAPTIST, TO PREPARE THE WAY! LOVE U! LOVE GOD WITH ALL OF YOUR HEART! DEVOUT YOUR SOUL LIFE & WEALTH TO - “THE GOD OF LOVE!” NOW! NOW! TRY TO LOVE ALL OTHERS WITH GOD’S LOVE! BE OF PEACE! FORGIVE THE WAY YOU WANT TO BE FORGIVEN! PRAY FOR YOUR FORGIVENESS FOR CHOOSING MONEY OVER GOD! INIQUITY OVER EQUITY! FOR NOT SUPPORTING THE ONLY OBVIOUS EGALITARIAN SOCIETIES OF GOD’S LOVE - HELPING “THOSE IN NEED!” THE NORDIC MODEL COUNTRIES! FOR SUPPORTING “THE GREED OF THE FEW!” VERSUS HELPING “THOSE IN NEED!” FOR - NOT BECOMING “ONE WITH - THE ONE!” GOD’S LOVE! Matthew 7:21-23 King James Version 21 Not every one that saith unto me, Lord, Lord, shall enter into the kingdom of heaven; but he that doeth the will of my Father which is in heaven. FATHER’S WILL IS TO HAVE SUSTAINABLE HUMANE AND EGALITARIAN SOCIETIES/MARKETS! ”THE NORDIC MODEL!” AS IT IS IN HEAVEN IT SHOULD BE ON EARTH! 22 Many will say to me in that day, Lord, Lord, have we not prophesied in thy name? and in thy name have cast out devils? and in thy name done many wonderful works? 23 And then will I profess unto them, I never knew you: depart from me, ye that work iniquity. RIGGED! KOCHS TAKE OVER COVID & HEALTHCARE! "ICE FREE ARCTIC!" UNLEASHES "HOT STUFF" "GIGATONS OF METHANE!" CAUSED BY STRONG EL NINO EARTHQUAKES SUPER STORMS AMOC COLLAPSE REDUCED ALBEDO BY 2023-2027! ADD "LATENT HEAT OF FUSION!" = "MELTING OF ANTARCTICA!" JOE DO "THE SUMMIT TO SAVE OUR SPECIES!" AND "ONE LOVE!" OR FRY WHEN YOU DIE! METHANE EXPLODES! IPCC ISSUES NO METHANE NON-SCIENCE! ARCTIC ICE BY GEOENGINEERING!? AMOC COLLAPSE EXPLODES GULF TEMPS! SUPER STORMS DESTROY GULF BY 25! "It Is THE END!" 2030! REMEMBERING - CHENEY BUSH STOLE B-TRILLIONS DOING 9/11! A NEWS WOMAN CALLED BLD 7 DOWN LIVE ON TV! ROCKEFELLER TOLD RUSSO 9/11 WOULD HAPPEN 11 MONTHS BEFORE AND ROCKEFELLER TOLD RUSSO "SATAN'S MAFIA GLOBAL DEPOPULATION AND POLICE STATE AGENDA!" NO VACCINES FOR POOR COUNTRIES IS SATAN'S MAFIA DEPOPULATION AGENDA! It Is THE END! ENJOY HELL! "THANK GOD!" . . "It Is THE END!" . OF . "RUTHLESS RULE BY THE EVIL RICH!" THEIR OPERATORS AND ANTI-CHRISTIAN WHORES! . . OMG! "THE ARCTIC OCEAN" IS . . "ON FIRE!" . . "HOT STUFF!" WILL ARISE ON "TRUMPET COCAINE!" SOON! THE FINAL WARNING TO "SATAN'S STATES OF EVIL GREED!" "SUPPORT THE NORDIC MODEL" & "GIVE TO THOSE IN NEED!" THE NORDIC THEORY OF LOVE - VS - SATAN’S EMPIRE OF EVIL GREED’S THEORY OF “ALL FOR ME!” “FUCK YOU-ISM!” OR "FRY BABY FRY!" SOON! STAND AGAINST THE PURE EVIL INIQUITY OF WEALTH INCOME & JUSTICE IN THE US & GLOBALLY! SEEK - NOT - TO STORE UP WEALTH ON EARTH! BUT IN HEAVEN! RARELY WILL A RICH PERSON ENTER HEAVEN UNLESS THEY GIVE AWAY THEIR INSANE INCOME (BAGS OF HARVEST) AND INSANE WEALTH (HUMPS ON THEIR BACKS) TO “THOSE IN NEED!” FOR THE LOVE OF GOD! WILL THEY FIT THROUGH THE EYE OF THE NEEDLE! HEAVEN! WORTH OVER $5 MILLION? GIFT EXCESS OVER $5 MILLION IN ASSETS AND A $5 MILLION HOUSE PER FAMILY BY 2025! IS YOUR NET WORTH FROM $1 TO $5 MILLION - GIFT 10% OF TOTAL INCOME! UNDER $1 MILLION - WHAT YOU CAN! T0 - “THOSE IN NEED!” STRETCH! SHOW GOD HOW MUCH YOU LOVE GOD! BY SHOWING YOUR LOVE FOR - THOSE IN NEED! YOUR LOVE AND HELP FOR - “THOSE IN NEED” - MAY - “SAVE YOUR SOUL!” SAVE A CHILD IN NEED! GIVE THAT CHILD A GOD / GOOD CENTERED HOME AND UPBRINGING! THE CHILD’S LOVE WILL SAVE YOUR SOUL! DON’T GET TOO MANY CHILDREN! ONE IS GOD! IT IS SIMPLY WHAT - “A GOOD SOUL” - WORTHY OF ETERNITY - ONE IN GOD’S LOVE WOULD DO! BY 2023-2027 IT WILL BE - MAD MAX! RAISE YOUR SPIRITS UP TO GOD! “ASCENSION THURSDAY 2025!” OR SPIRITUALLY MEANINGFUL DAY TO YOU! A NICE SUNSET! GET YOUR SUCK BAGS - NOW! PREPARE YOUR SOUL! PREPARE YOUR FAMILIES! LOVE GOD! GIVE TO & HELP THOSE IN NEED! SUPPORT “THE NORDIC MODEL!” NOW! . . NOW! NARROW IS THE ENTRANCE TO HEAVEN! THE NORDIC MODEL SUPPORTERS! WIDE IS THE GATE TO HELL! THOSE NOT SUPPORTING SUSTAINABLE HUMANE AND EGALITARIAN! MY MAIN GOAL! . . . . “TO SAVE YOU!” LET JESUS, SARAYU AND MAMMA - “THE LOGICAL GOD OF LOVE!” GUIDE YOU HOME! NOW! 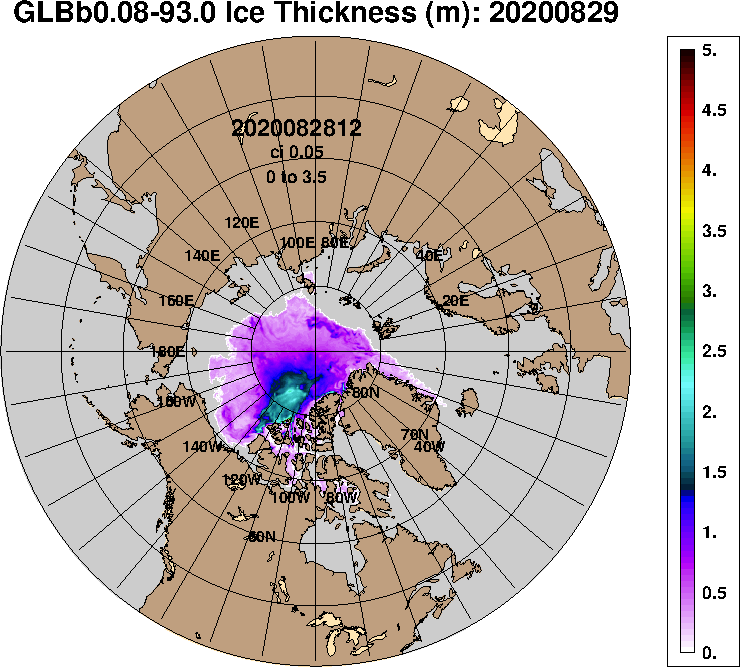
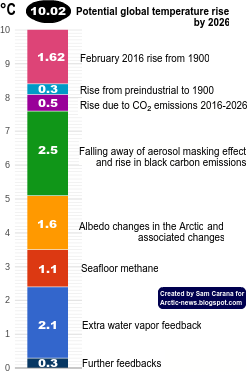
“GET YOUR SUCK BAGS” NOW! TIME TO “RAISE OUR SPIRITS UP TO GOD!” BY “ASCENSION THURSDAY 2023” AT THE LATEST!
MY MAJOR SCIENTIFIC ARGUMENTS: WITH ONLY A 3-5C RISE IN GLOBAL TEMPS GMAT, ABOVE PRE-INDUSTRIAL TEMPS, 2-3 ABOVE TODAY, CORE SAMPLES BY ANDRILL IN ANTARCTICA PROVED THAT IT CAUSED 60 FEET PLUS SEA LEVEL RISE. ANTARCTICA MELTED 60 TIMES AT THESE TEMPS, WEST AND EAST. PER SAM CARANA 2 C WAS HIT FEB 2020. AN ADDITIONAL 1-3C WILL BE HIT BY 2023-2027! “The last time the Earth experienced a comparable concentration of CO₂ was 3-5 million years ago, when the temperature was 2-3°C warmer and sea level was 10-20 meters (30’ TO 60’) higher than now. But there weren’t 7.7 billion inhabitants,” said WMO Secretary-General Professor Petteri Taalas. 30’-60’ SEA LEVEL RISE BLOWS UP MOST OF THE 440 NUCLEAR REACTORS! DUE TO “THE REDUCTION IN GLOBAL DIMMING” - CAUSED BY DR DEATH’S KILLER COVID! CAUSING A COLLAPSE IN GLOBAL ECONOMIES! “HOT STUFF” “THE CLATHRATE GUN FIRING ON TRUMPET COCAINE” WILL HAPPEN BY 2025! DUE TO “COMPLETELY ICE FREE ARCTIC” BY 9/2023-9/2027! “MASSIVE RELEASES OF SIBERIAN METHANE” WILL CAUSE 2-3C RISE IN GMAT BY 2025-27! MELTING ANTARCTICA WEST & EAST RAPIDLY! CAUSING 60’ SEA LEVEL RISE BY 2025-2030! THIS DESTROYS MOST OF THE 440 NUCLEAR REACTORS. GAME OVER “It Is THE END!” HENCE MY PROPOSAL FOR 350-400’ PYRAMID STRUCTURES AROUND NUCLEAR REACTORS, SINCE WATCHING THE ANDRILL VIDEO 2017. ALONG WITH “SIBERIAN METHANE CAPS” TO SEQUESTER METHANE! STORING IT IN TANKS! “THE MONSTER SUPER STORMS” AND STORM SURGE MAY DESTROY NUCLEAR REACTORS, SOONER THAN SEA LEVEL RISE. BY 2025 THE GULF & FLORIDA WILL BE DESTROYED BY “THE MONSTER SUPER STORMS” - EXIT NOW! THIS IS “HERD GENOCIDE“ - NOT - “HERD IMMUNITY!“ THIS IS THE GLOBAL DEPOPULATION AND POLICE STATE AGENDA! “It Is THE END!” BY 2030-2040! “HERD GENOCIDE!” NOT “HERD IMMUNITY!” PART II. Americans Are Dying At Rates Far Higher Than Other Countries! 8 MILLION MORE POOR! “HERD GENOCIDE III” COVID LONG-HAULERS! ACCELERATES “GLOBAL DIMMING!” CAUSING “ICE FREE ARCTIC!” 9/2022 UNLEASHING “HOT STUFF!” MELTING ANTARCTICA! GMAT 2-3C RISE = 60’ SEA LEVEL RISE 2025-30! BLOWING UP 440 NUCLEAR REACTORS! “THE END!” MY PRAYER FOR - “THE REST” - SUPPORTING - “THE EVIL RICH!” CHRIST’S COMMANDS US TO - COMMAND THE RICH TO “TAKE CARE OF THOSE IN NEED!” TO ENTER HEAVEN! MY INSPIRATIONS OF WHAT YOU MUST DO IN TODAY’S TERMS - TO ENTER GOD’S HEAVEN! MOVE TO - CANADA - NOW! IF YOU CAN! BANF TO LAKE SUPERIOR UP TO HUDSON BAY, EAST. NORDIC COUNTRIES. NEW ZEALAND IF YOU CAN AFFORD TO. LAKE TAHOE, LAKE CHAMPLAIN, GREAT LAKES EAST TO COAST IN US! MUCH OF MY WORK IS IN ALL CAPITALS - most of others works are in non-caps. Sources are linked - blue text. POSTS TO RAISE YOUR SPIRIT UP TO GOD HUMANELY: GUYMCPHERSON.COM MAXDOGBREWING.COM PEACEFUL PILL HANDBOOK.COM SUICIDE.ORG DUE TO - “THE LATENT HEAT EFFECT!” - UNLEASHING - “HOT STUFF!” I COMPARE MY FORECAST FOR EXTINCTION TO SAM’S AND GUYS!!” CAUSING GMAT TO RISE BY 18 C / 32.4 F BY 2026 ACCORDING TO SAM CARANA!
LOTS OF VIDEOS - TAKES TIME TO LOAD! New Topic /Videos Each Post Plus Key Videos ALL CREDIT FOR TRUTH IS TO - "THE ONE" - THE SUNSHINE BAND AND AUTHORS NOTED. MY CREDIT IS FOR ANY MISTAKES! SORRY! THE NORDIC MODEL & The Final Judgement: Take Care of "Those in Need!" Or Fry in Hell! Christ IS "The First Great SOCIALIST!" Last Warning! SUPPORT THE NORDIC MODEL or FRY Baby FRY! WHEN YOU DIE, BABY, DIE! SOON!
GLOBAL POLICIES TO SAVE THE SPECIES: ONE LOVE CLIMATE REFUGEES & PRISON COMMUNITIES ENCASE NUCLEAR REACTORS - ENCASE POWER POLES - CAP SIBERIAN AND ARCTIC METHANE - TRANSITION TO PRIMARILY SOLAR AND WIND - USING THE SAVE THE SPECIES - NON-DEBT BASED CURRENCY! EFFECTIVELY A NORDIC MODEL / RESOURCE BASED GLOBAL RENEWABLE ENERGY ECONOMY! - NOW! ALL POSTS (clickie) TOP POSTS: "THE LOGIC OF THE GOD OF LOVE!" MEDICARE FOR ALL - CHRISTIAN! CAPITALISM - EVIL! DO YOU CHOOSE - MONEY OR GOD! "MY HIS STORY" ANTARCTICA MELTING RAPIDLY! ANDRILL 2016 VIDEO - 60-75 FOOT SEA LEVEL RISE WITH 400 PPM CARBON, SAME AS TODAY, AND JUST SLIGHTLY HIGHER TEMPS THAN TODAY! "LIVING GIVING NETWORKS:" THE THEISTIC HUMANISTIC MODEL FOR ACHIEVING -"ONENESS" - WITH - "GOD'S LAW" - TO TAKE CARE OF - "THOSE IN NEED!" TO ACHIEVE "THE SHE MATRIARCAL NORDIC MODEL!" (not a business solicitation) "BECOMING ONE" CORONAVIRUS HELL ON EARTH! THEN - "HOT STUFF"- IS UNLEASHED! EXIT - THE GULF & FLORIDA - NOW! “THE MONSTER SUPER STORMS” WILL DESTROY THEM . . . . BY 2025! OMG! "GET YOUR SUCK BAGS" NOW! "THE HAMMER AND THE DANCE!" THE MOST HORRIFIC CASE. . . . . "It Is THE END!" WORLD'S ONLY MAJOR TERRORISTS GROUP! THE EVIL RIGHT WING! "AS IT IS IN HEAVEN - SO SHOULD IT BE ON EARTH!" SUPPORT THE ONLY CHRIST LIKE SOCIETY OR FRY IN THE HELL YOU SUPPORT! RIGGED - The GREAT SIBERIAN METHANE COVER UP! CAN "THEY" FIX IT? STOP HELL ON EARTH? "HOT STUFF LIVES?" The Clathrate Gun Fired FOR FULL SCREEN: Login to Youtube FIRST, then Open My Site, Then Click on Video you Want Full Screen. Now Go To Youtube, Switch Screens, Click on History, the First Is the Video You Clicked On - On My Site! If NOT close All, Repeat Process. MUST READ and WATCH The Nordic Theory of Everything / Love, and Anu Partanen’s writings Viking Economics: How the Scandinavians Got It Right - And How We Can, Too; The Secrets of The Nordic Model, by the same author, and The Nordic Perspective! US CORPORATE STATE SOCIALISM, Fascist Monopolistic, Homo and Transphobe, Racist, Kleptocratic / Thieves, Oil War Imperialist Focused, "ALL for THE RICH" - - "RAPE THE REST!" Especially Destroy the Lives of the Truly Good People Who Stand against THE EVIL GREED of THE FEW, The Sunshine Band. UNTIL The Horrific Demise of ALL God's Children, God's Species and Wonder Filled World for THE EVIL GREED OF THE FEW . . . . . . . . is EVIL! THE NORDIC MODEL: Libertarian Democratic Market Socialism: Denmark, Finland, Norway, Sweden, are Sustainable, Humane and Egalitarian (Think - SHE - The Matriarcal Nordic Model). . . . . . .it is GOOD! Vote for THE MATRIARCAL NORDIC MODEL - NOW! Jill Stein, Bernie Sanders, Alexandria Ocasio-Cortez - AOC, and The Squad 2024! VOTE! MY HEROS OF "THE MATRIARCAL NORDIC MODEL!" BELOW BERNIE SANDERS AND ALEXANDRIA CORTEZ 2020! IF NOT, JILL STEIN AND ABBY MARTIN - GREEN PARTY - 2020! 


"God's Girls!" "GG's Community," God's Gifted, think "The Beatitudes," is the Amazing Arts Colony We Will Be playing, singing, praising, loving, adoring God at Soon! Think billions of souls coming to see you, millions daily! Loving U!
MY HEROS, ABOVE:
LESTER BROWN, "WORLD ON THE EDGE," "PLAN B 4.0," EARTH-POLICY.ORG DR. GUY MCPHERSON, FATHER OF "ABRUPT CLIMATE CHANGE" DR. JORGEN RANDERS, FATHER OF "THE LIMITS TO GROWTH!" AND, "2052: A Global Forecast for the next 40 Years!" MICHAEL MOORE - DOCUMENTARIAN - FOR - "JC AND THE SUNSHINE BAND!" EXCEPTIONAL DOCUMENTARIES! RICK STEVES - THE NORDIC MODEL - THE GOOD LIFE! POSTER CHILDREN, BELOW: EVIL TRUMP! OF "THANK GOD!" - - "It Is THE END!" "HOT STUFF!" "THE SIBERIAN METHANE MONSTER!" 

"House of Trump, House of Putin: The Untold Story of Donald Trump and the Russian Mafia"
“Damning in its accumulation of detail, terrifying in its depiction of the pure evil of those Trump chose to do business with.”--The Spectator (UK) 
Watch "THE SIBERIAN METHANE MONSTER" - ABOVE - BURN UP and SUPER STORMS DESTROY Planet EVIL GREED! DAILY! OH BOY, WHAT COULD BE MORE EXCITING THAN THAT!? OK, Her Name is . . . . . . . "HOT STUFF!"
"The Limits to Growth: A Final Warning" tells you about the authors work since the early seventies, my work since 1980, and the stage of the "science of overpopulation analysis." Dr. Jorgen Randers, "2052: A Global Forecast for the Next Forty Years," and Lester Brown, "World on The Edge," have portended the fate of the world, due to overpopulation since the seventies! However limited I see their understanding of "abrupt climate change." Archives
July 2024
Categories |
||||||||||||||||||||||||||
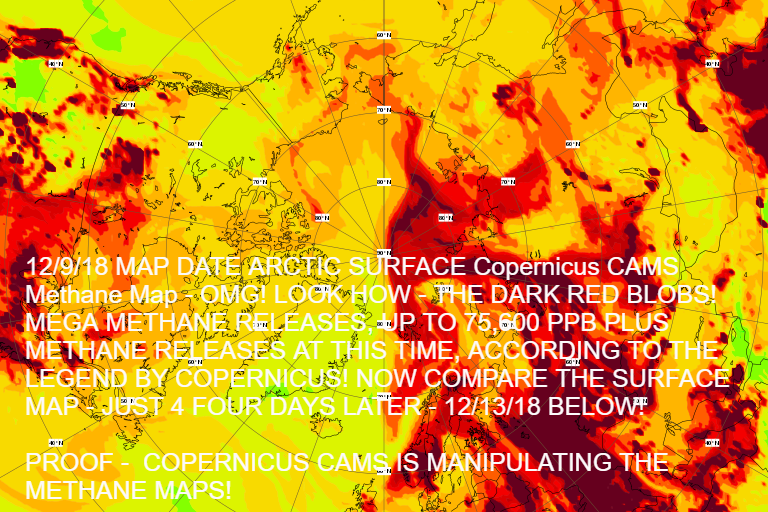
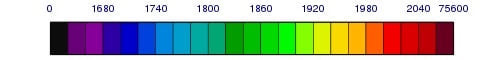
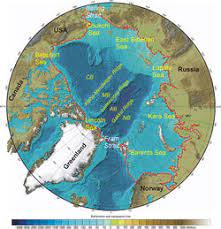
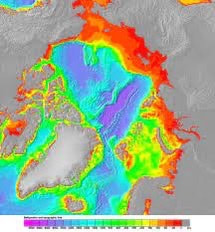
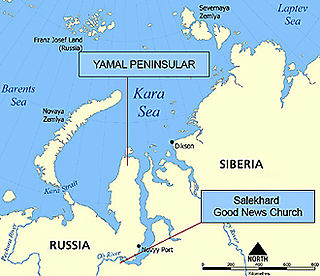

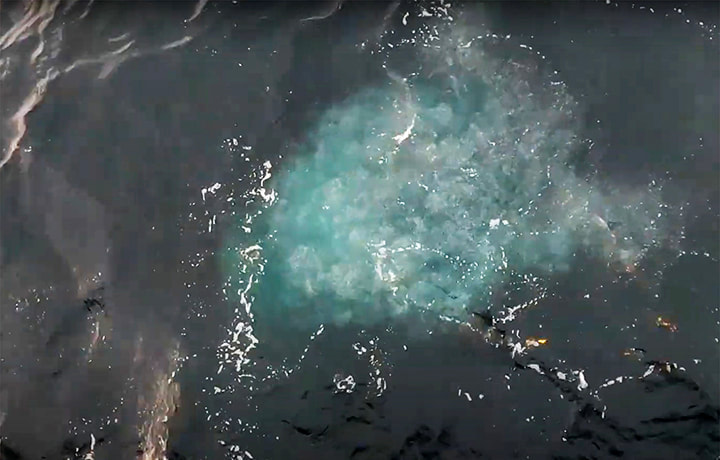
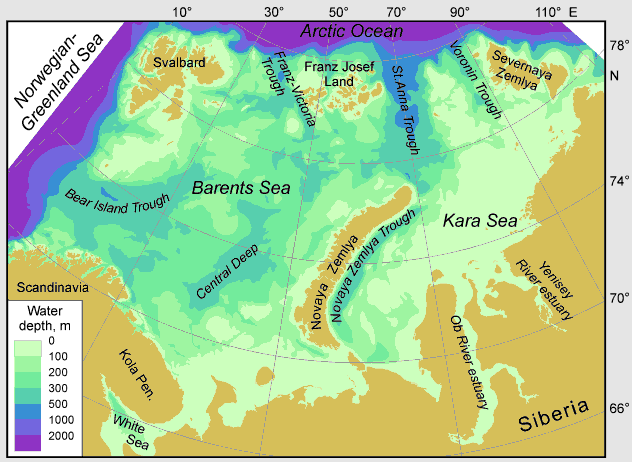
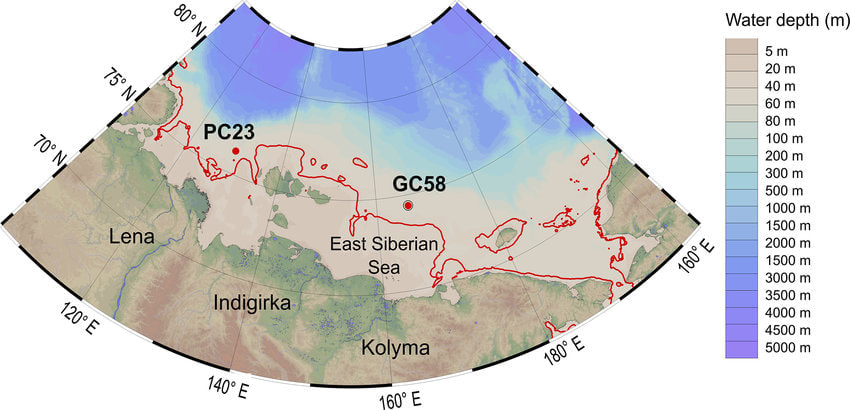
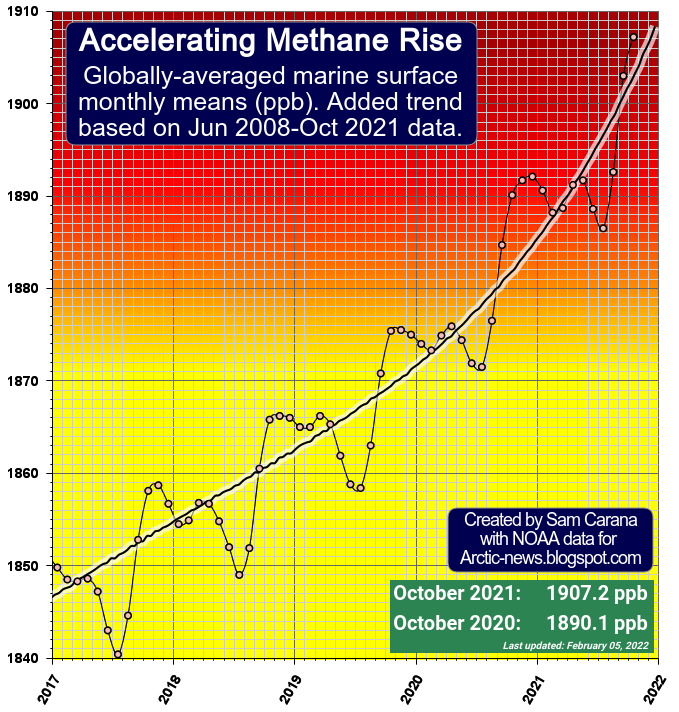
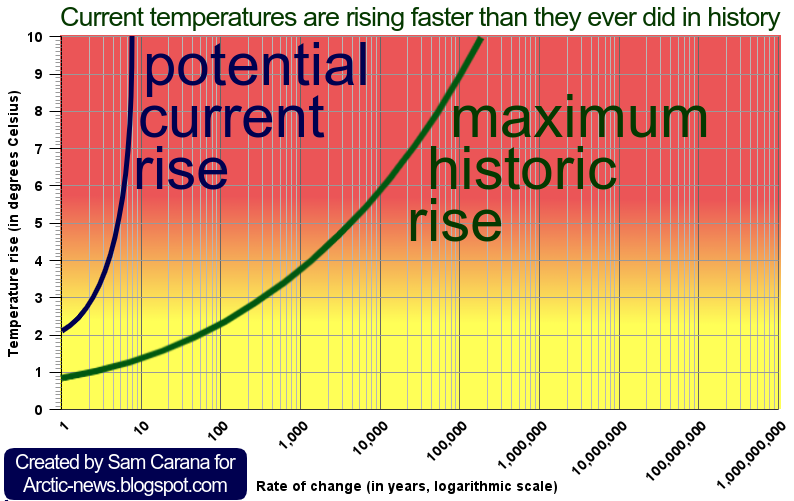
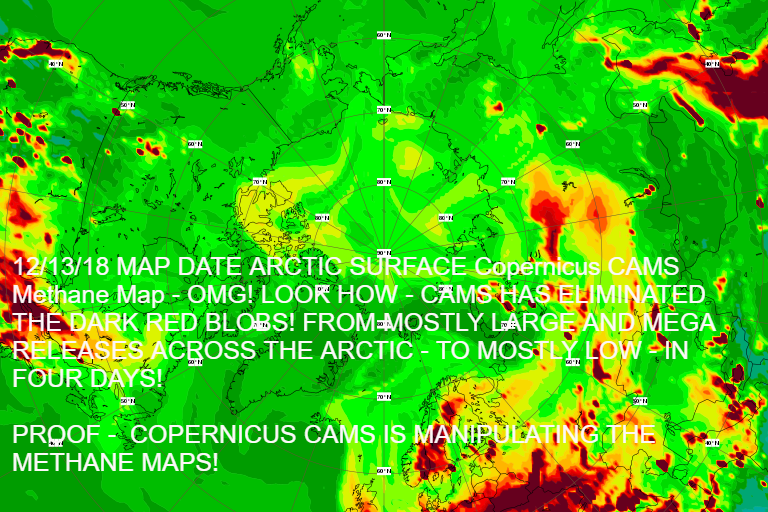
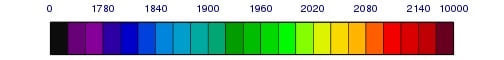
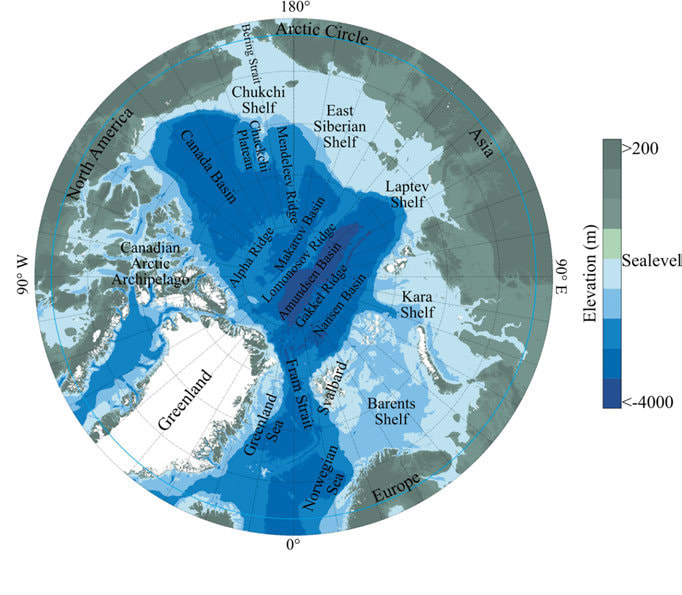
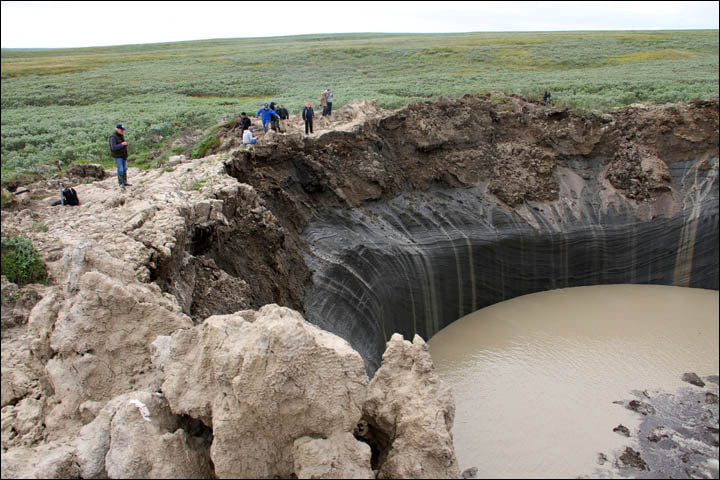
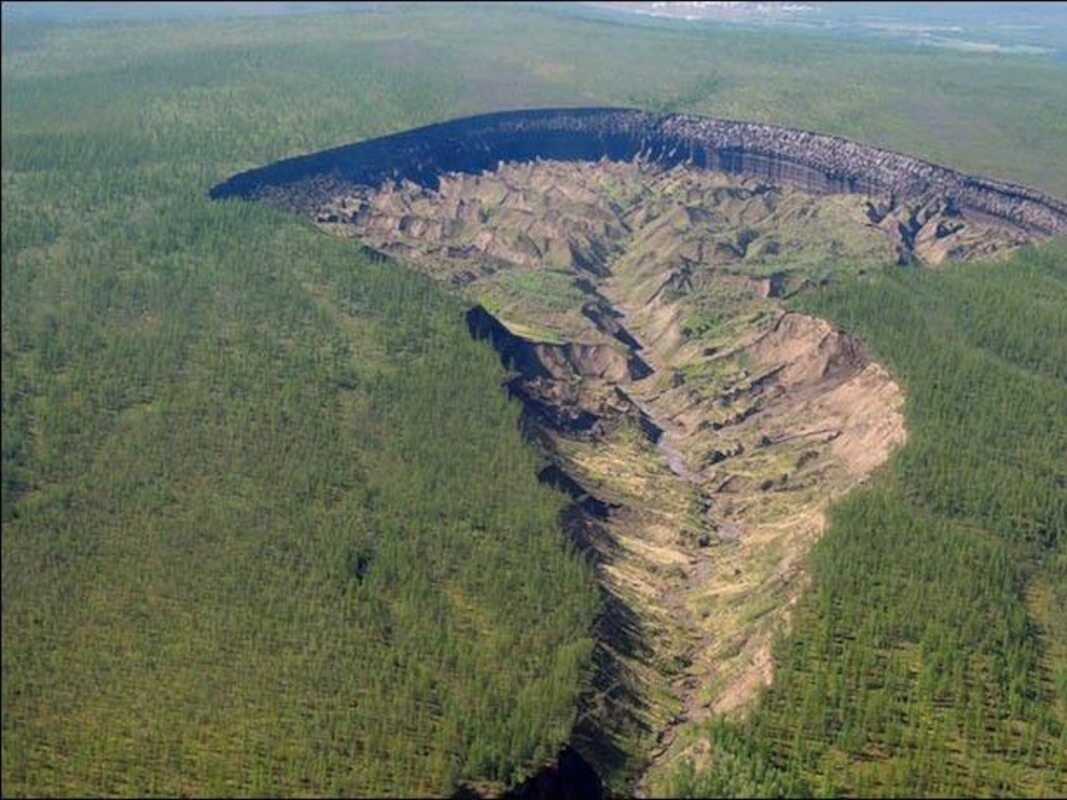
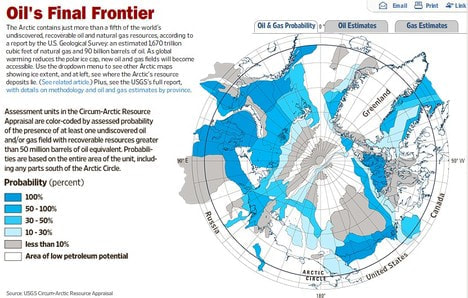
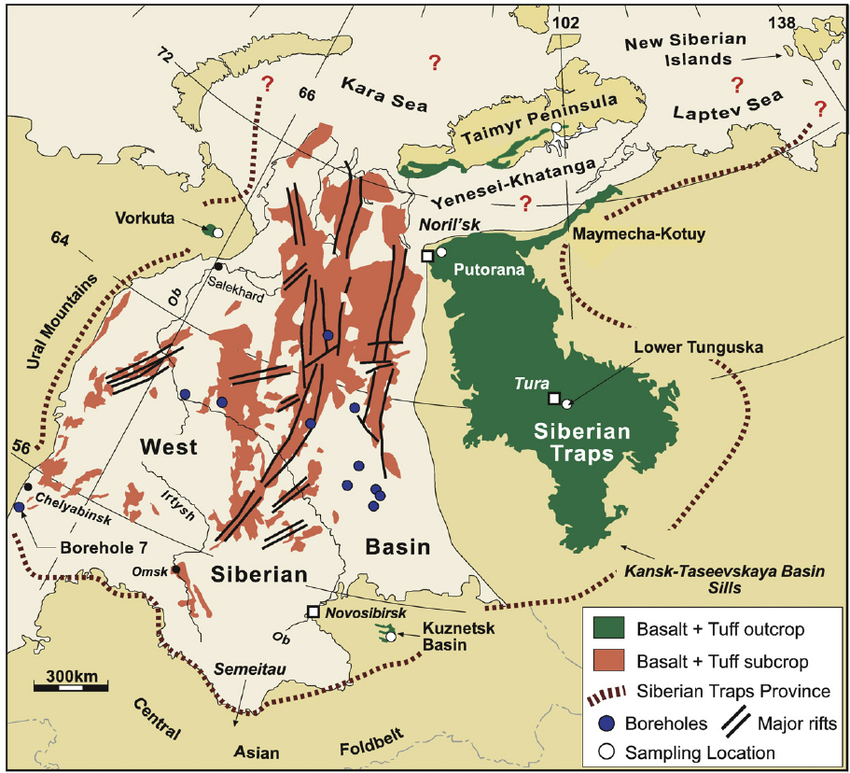
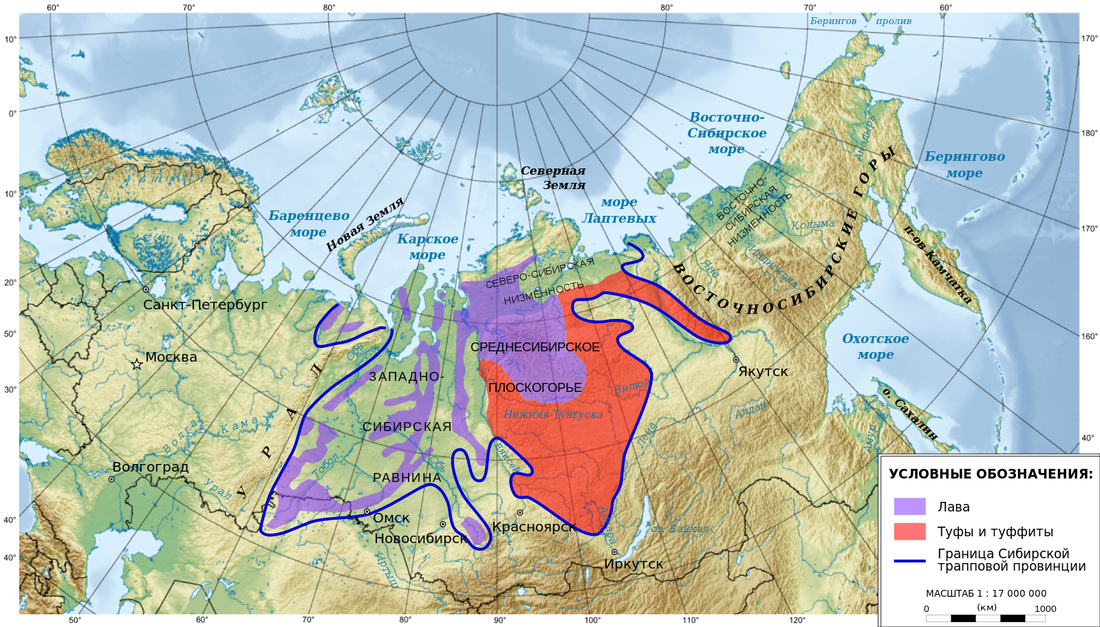
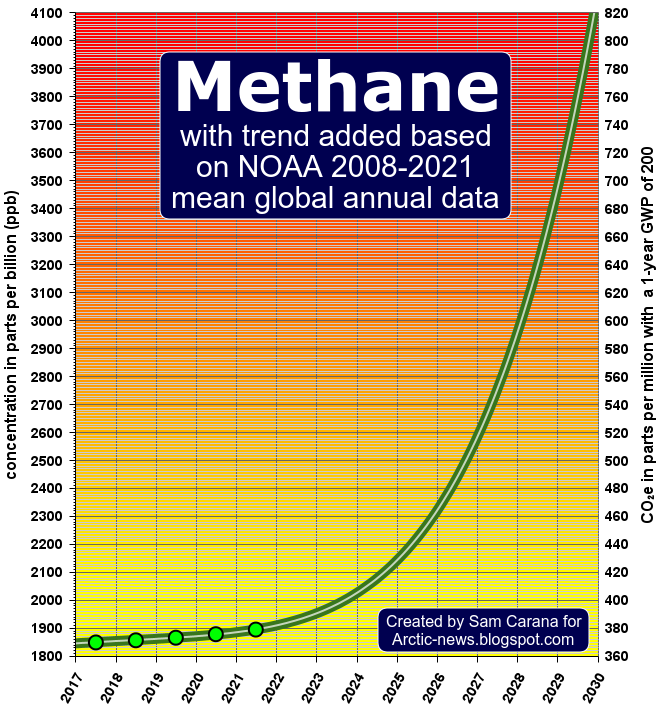
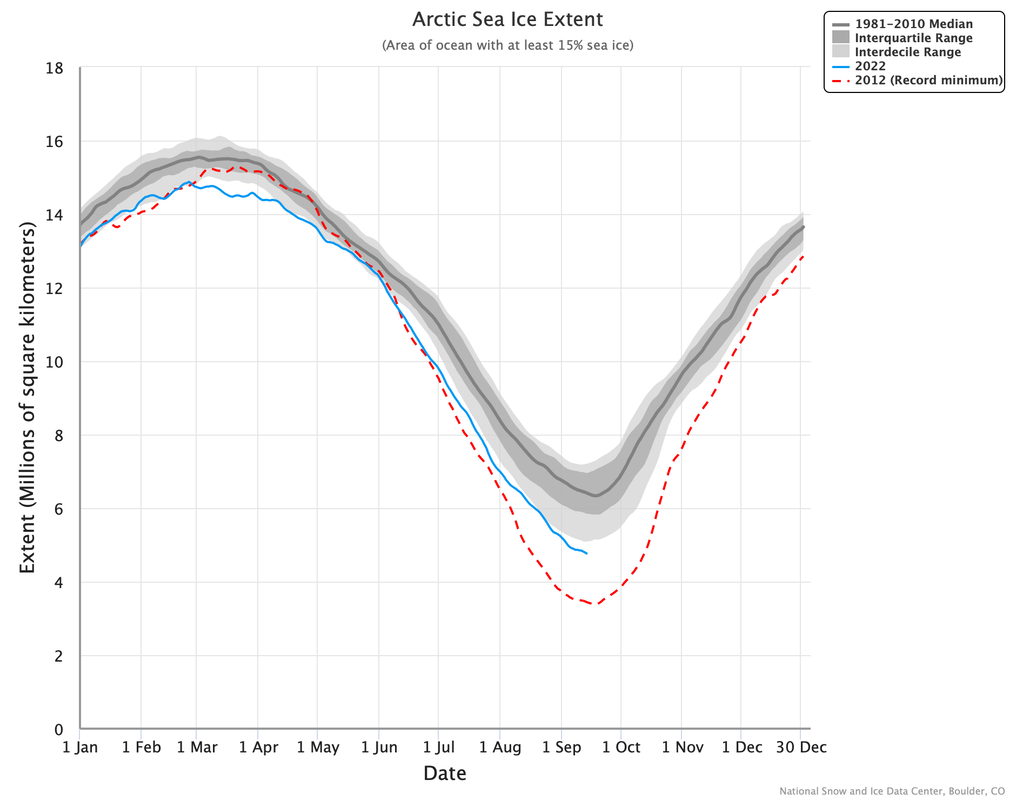
 RSS Feed